20 September, 2018
Thanks for visiting the site.
This month Apple just announce in their September event the new iPhones. So, what has this event and the stock price correlation. See the chart, picture worth a thousand words. Different people will have different understanding, what is your take away? Trade with your eyes open, do not because you are an Apple fan. I am an apple fan, but I mean the fruit. I enjoy eating apple, and apple pie.
You can find the new iphones in the following link, https://www.apple.com/sg/apple-events/september-2018/.
AAPL Apple Inc Charting
Buy Support Sell Resistance or Buy Low Sell High
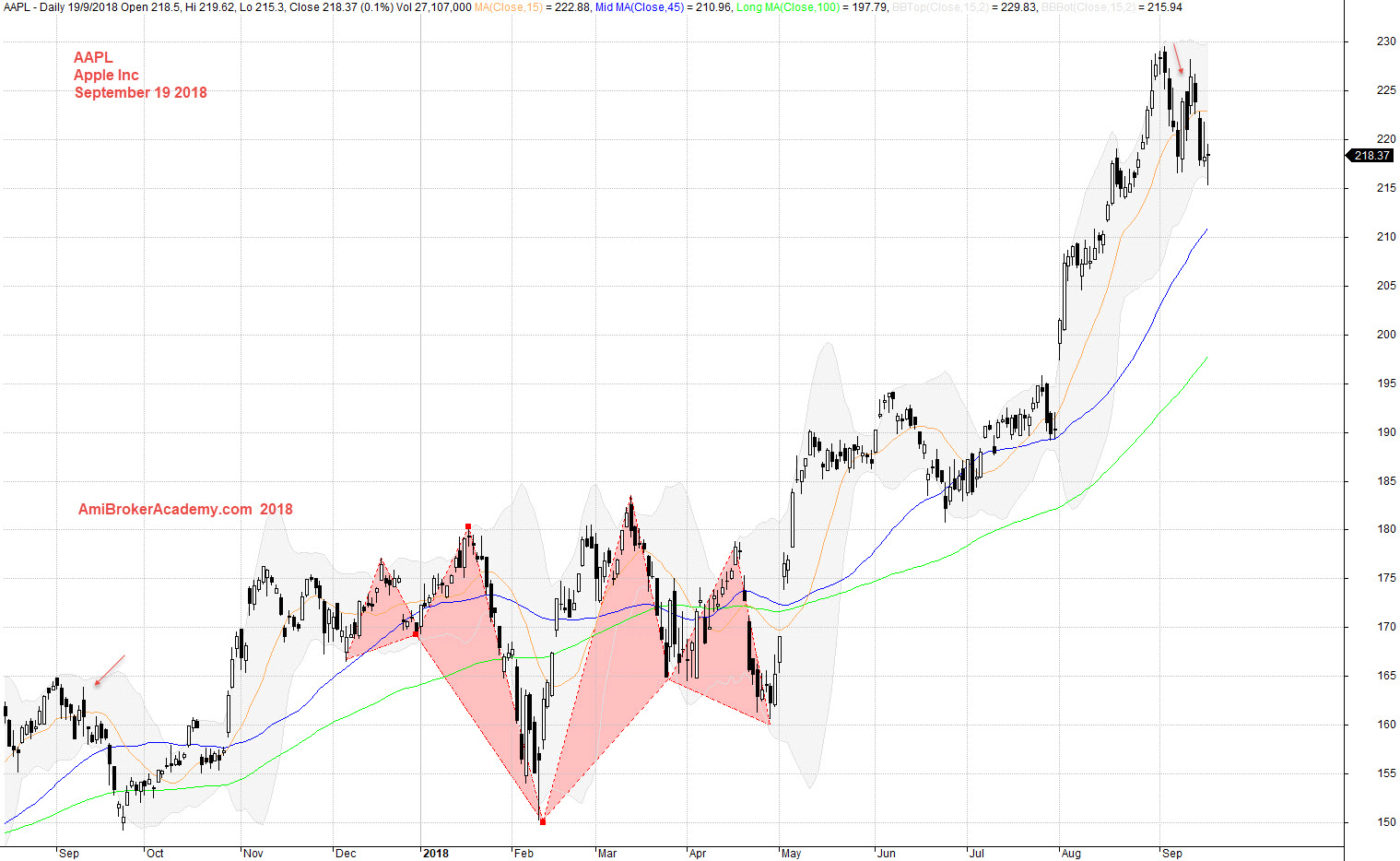
Study chart of Apple Inc price action. See price action from September last year, you can see Apple stock price goes higher and fail to retest the low. To certain extent the stock price went sideways. If you will reference the stock price to the Apple product, looks like the market does not impress by the new delivery. The stock price jump higher when Trump traffic policy kick start. Why? May be there is a rush for the sales just in case could not buy any iPhone in the near future. Or, something something. I don’t know. It is also not for technical analysis to understand the fundamental. Just study the chart and make trade plan.
Trade with eyes open.
Manage your risk.
We will study the same chart from different perspective. See the next few charts for more.
September 19, 2018 Apple Inc Charting
if you can see the full chart, “press Ctrl and -” to zoom out and see the entire chart.
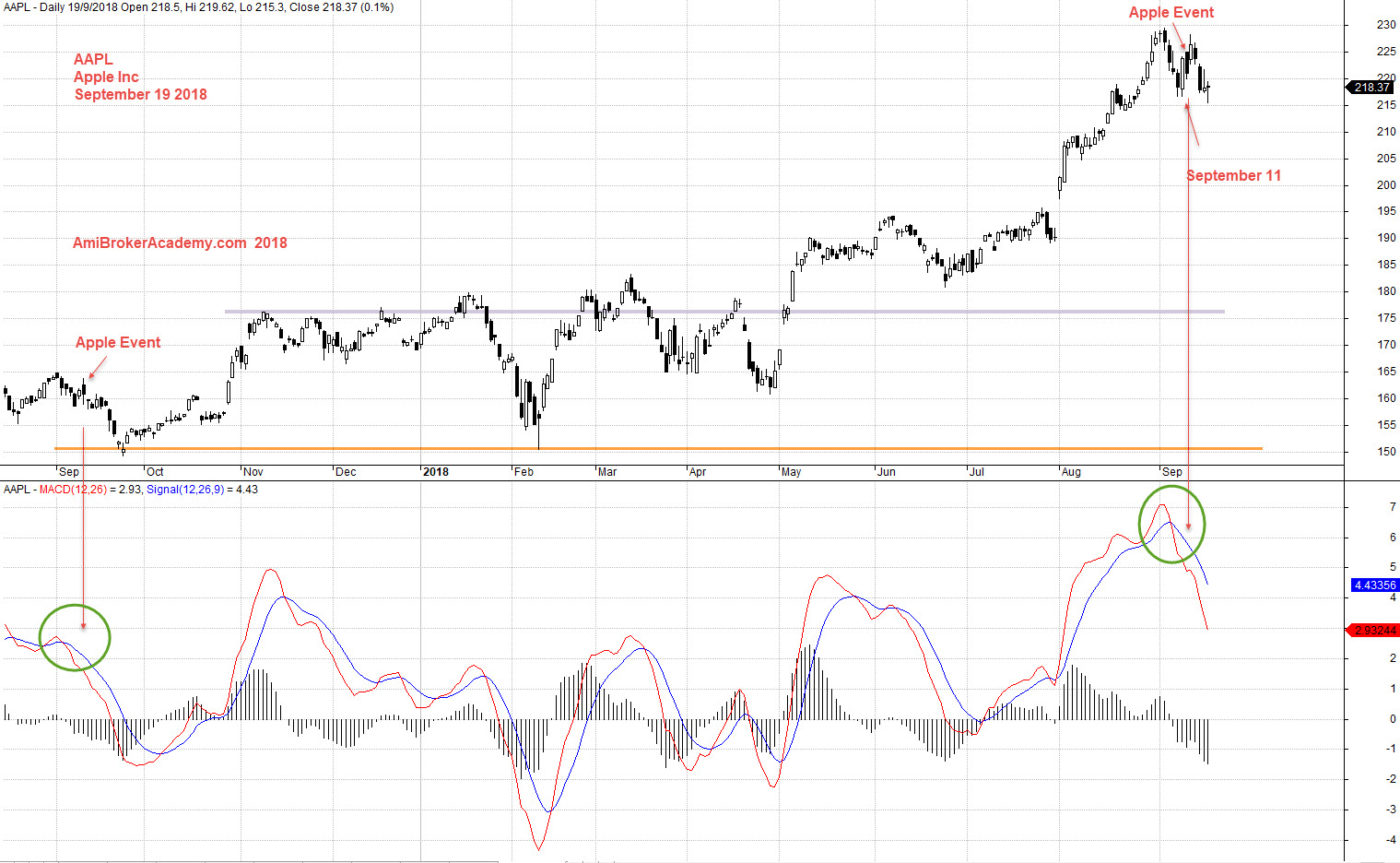
Add the MACD indicator, what is your take away for the correlation between the MACD signal and Apple’s event? Seem a pullback after the event, MACD cross down signal happened after the new iPhone. If the history repeat itself, then there will be a sideways shortly after the retest of low. Trade with eyes open.
September 19, 2018 Apple Inc Between Two September Events
Add a box on the sideways and see the support resistance and breakout. So, what you get?
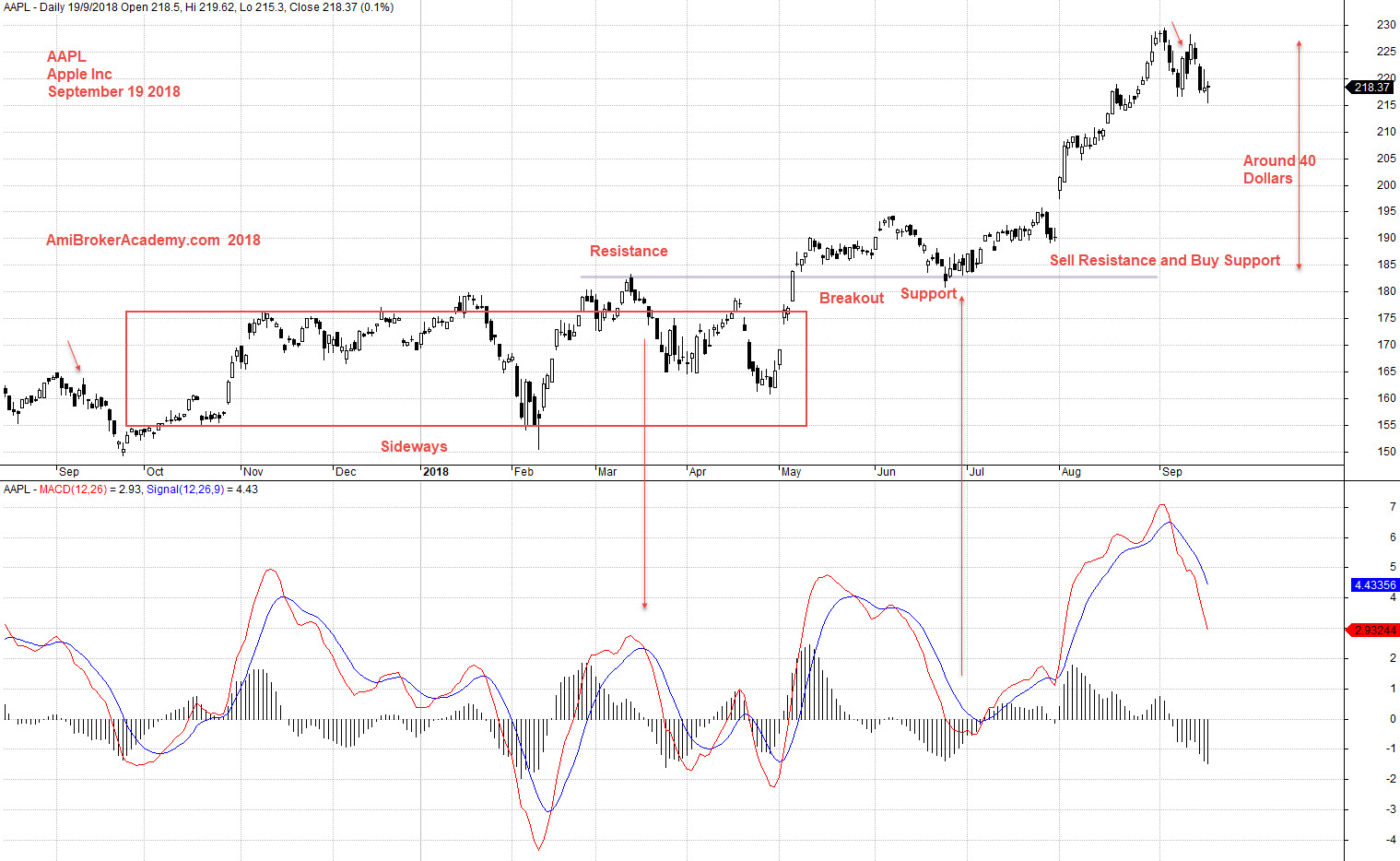
September 19, 2018 Apple Inc Buy Support Sell Resistance
Moses US Stock Chart Analysis
AmiBrokerAcademy.com
Disclaimer
The above result is for illustration purpose. It is not meant to be used for buy or sell decision. We do not recommend any particular stocks. If particular stocks of such are mentioned, they are meant as demonstration of Amibroker as a powerful charting software and MACD. Amibroker can program to scan the stocks for buy and sell signals.
These are script generated signals. Not all scan results are shown here. The MACD signal should use with price action. Users must understand what MACD and price action are all about before using them. If necessary you should attend a course to learn more on Technical Analysis (TA) and Moving Average Convergence Divergence, MACD.
Once again, the website does not guarantee any results or investment return based on the information and instruction you have read here. It should be used as learning aids only and if you decide to trade real money, all trading decision should be your own.