12 November, 2018
Thanks for visiting the site.
^NDX NASDAQ 100 Index Daily Charting
Buy Support Sell Resistance
Buy Low Sell High
Study chart of NASDAQ 100 Index stock chart.
As said before, H M Gartley 222 pattern is a great way to trade. See chart. With the Fibonacci Retracement, we could always predict a turning point. The possible turning point is like 50%, 61% and 78%. These are great level proven a turning point. See chart, we find a bearish candlestick pattern. Imagine the turning is true, then over the next few days, weeks, or months the price action will drop further south. See the next chart on the projection.
Remember to trade with eyes open.
Think think got more things.
Manage your risk.
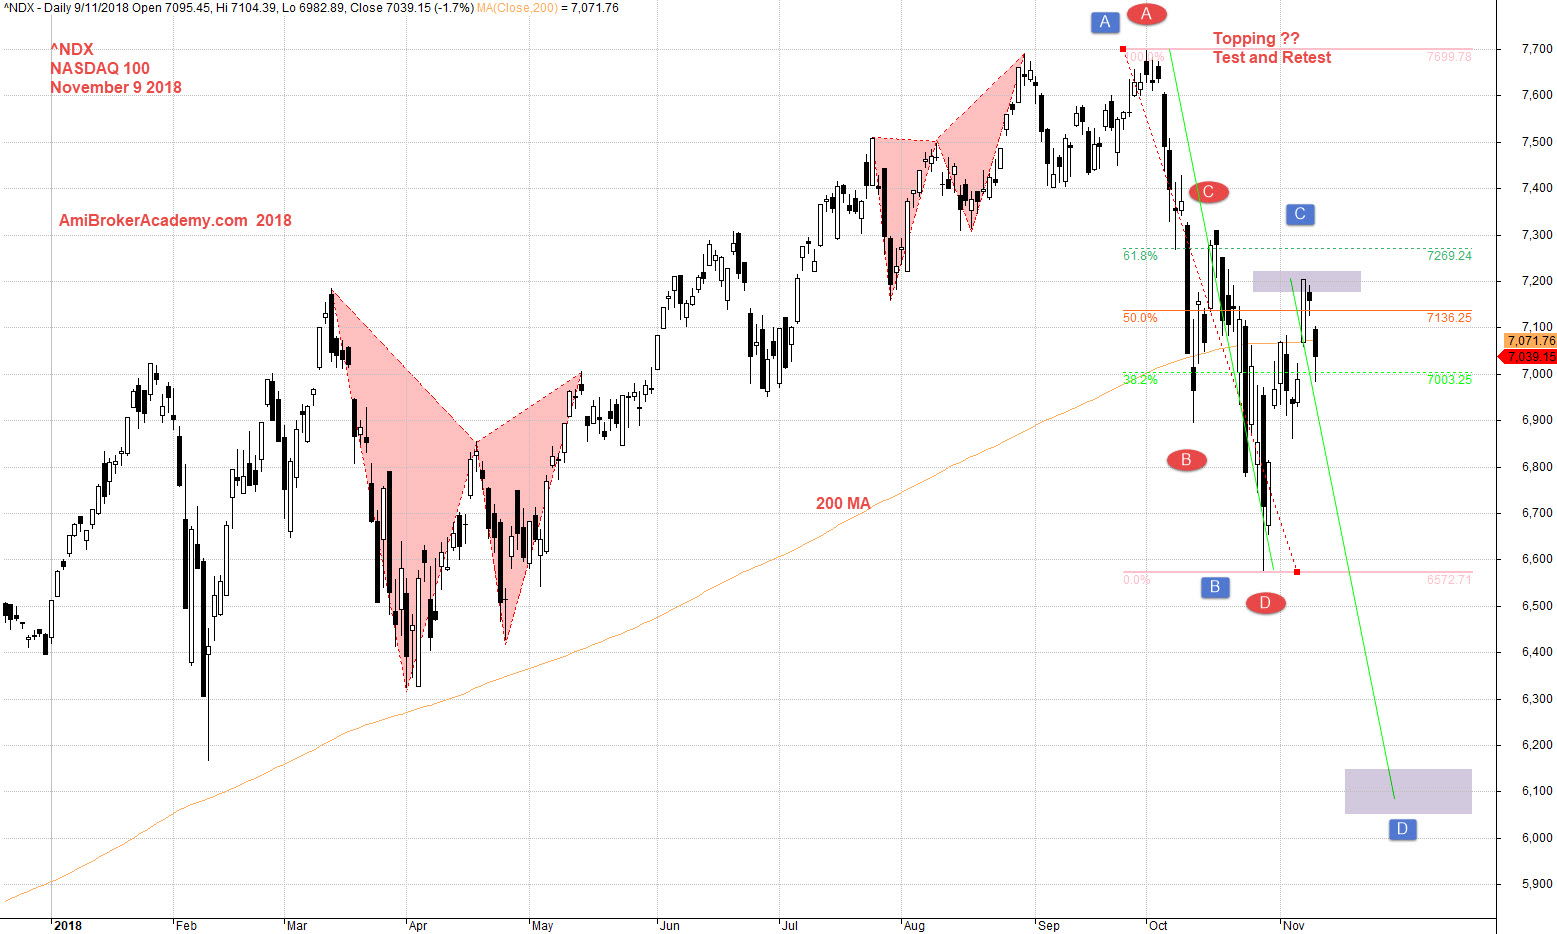
November 9, 2018 NASDAQ 100 Index and Fibonacci Retracement
if you can see the full chart, “press Ctrl and -” to zoom out and see the entire chart.
Add the Fibonacci Extension, we could see where the price action might be landing. See chart.
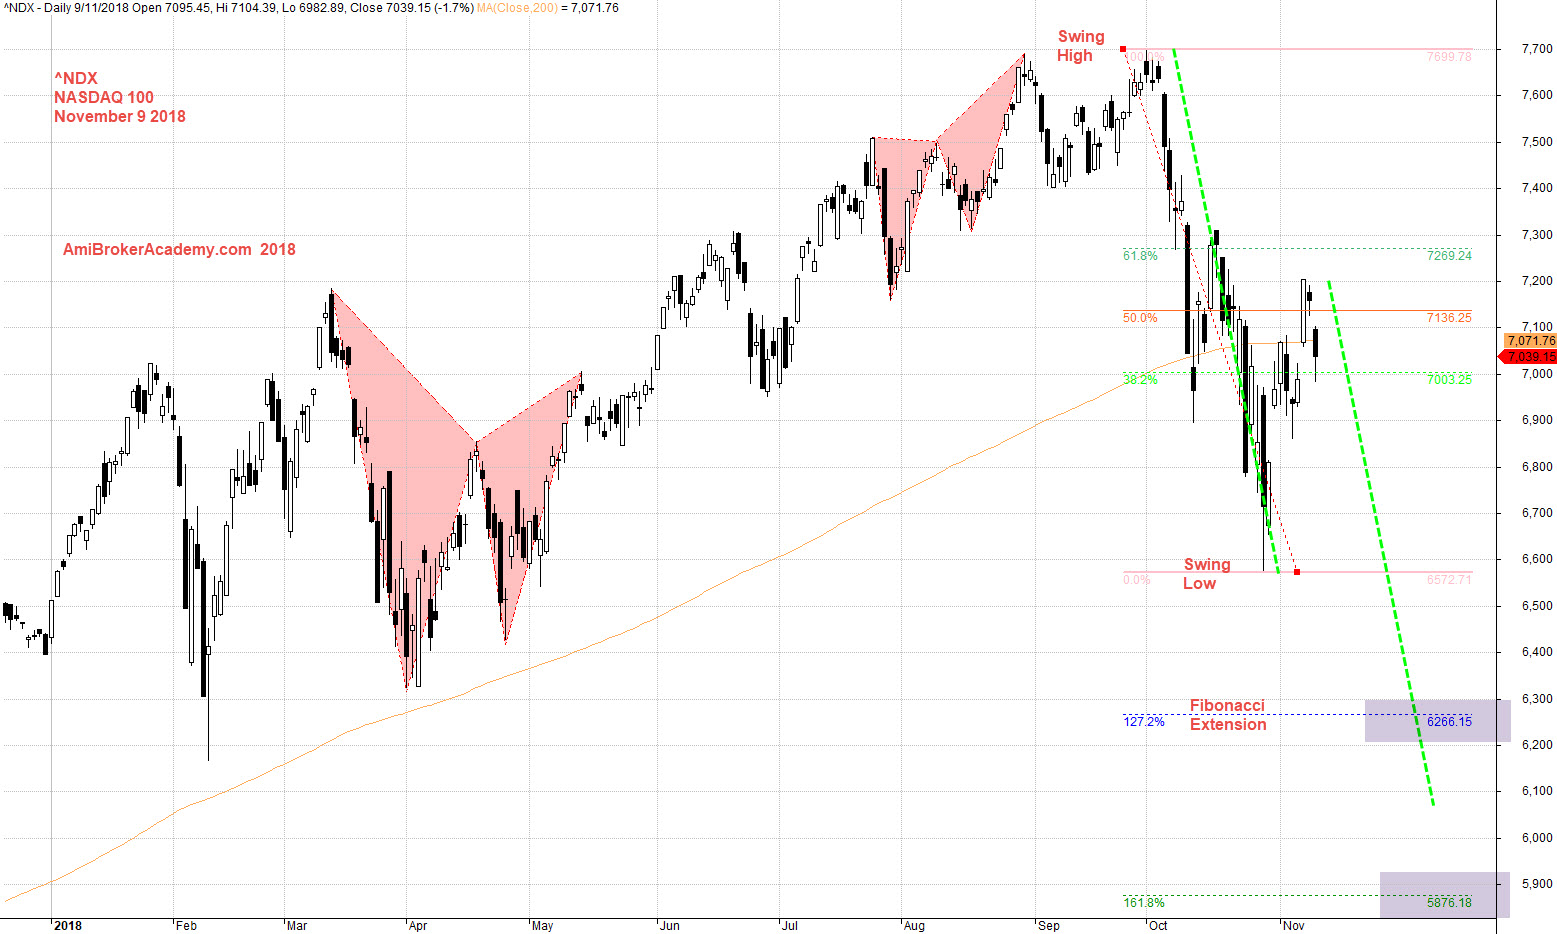
November 9, 2018 NASDAQ 100 Index and Fibonacci Extension
Add MACD indicator. See chart, picture worth a thousand words.
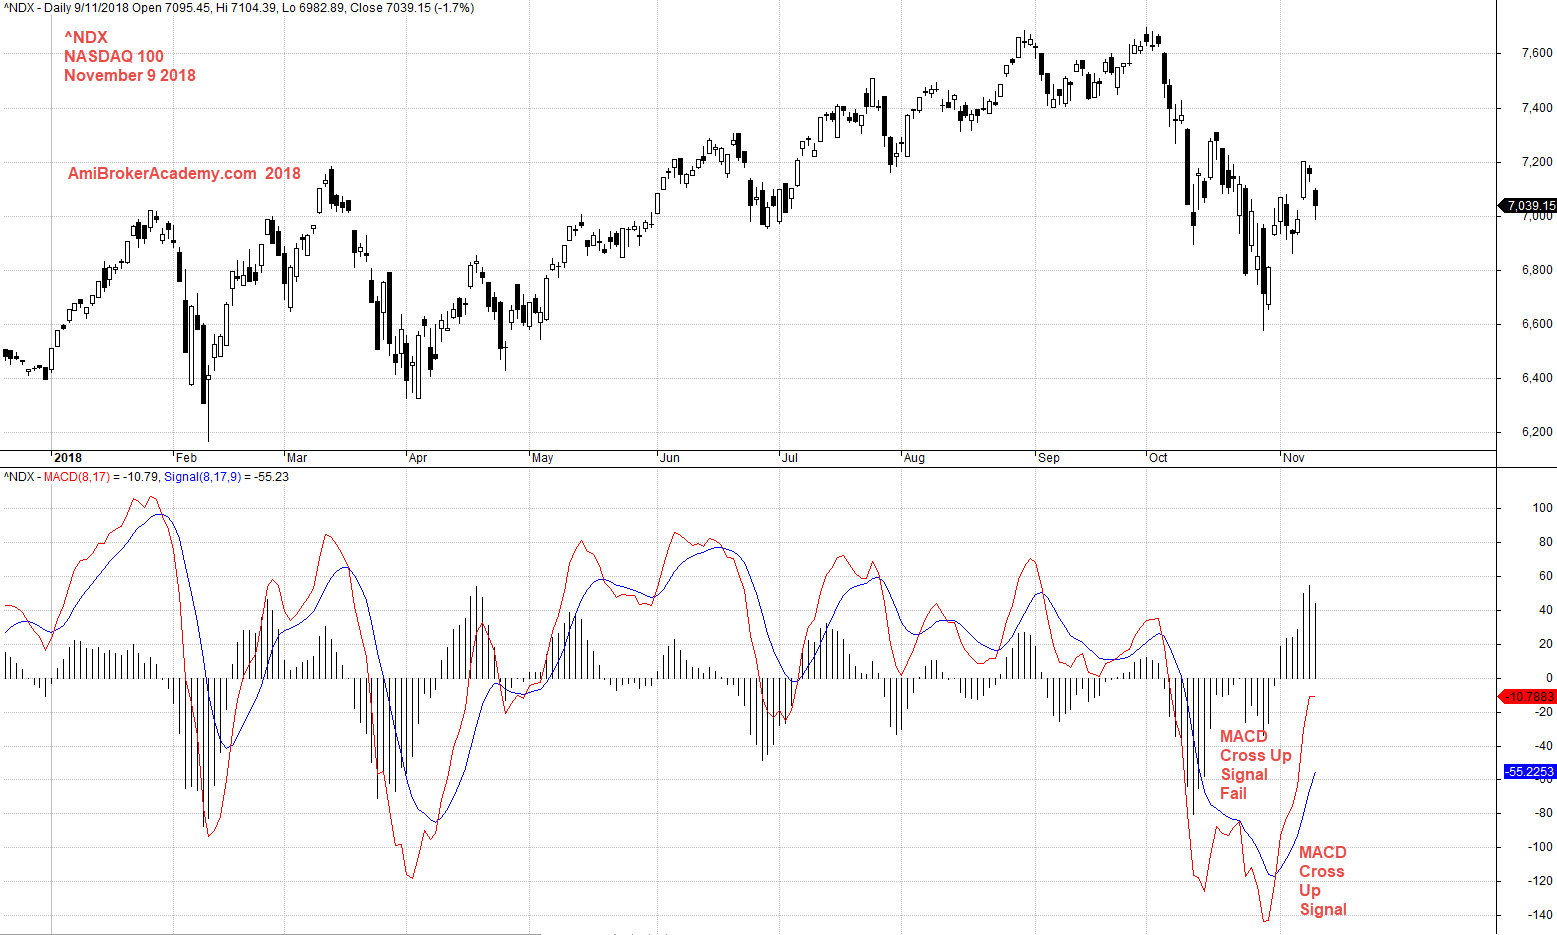
November 9, 2018 NASDAQ 100 Index and MACD
Moving Average is a great visual tools to see price action. Price action close below river, and resisted by river. River is slopping down. So, the dead cross is in progress. Will see.
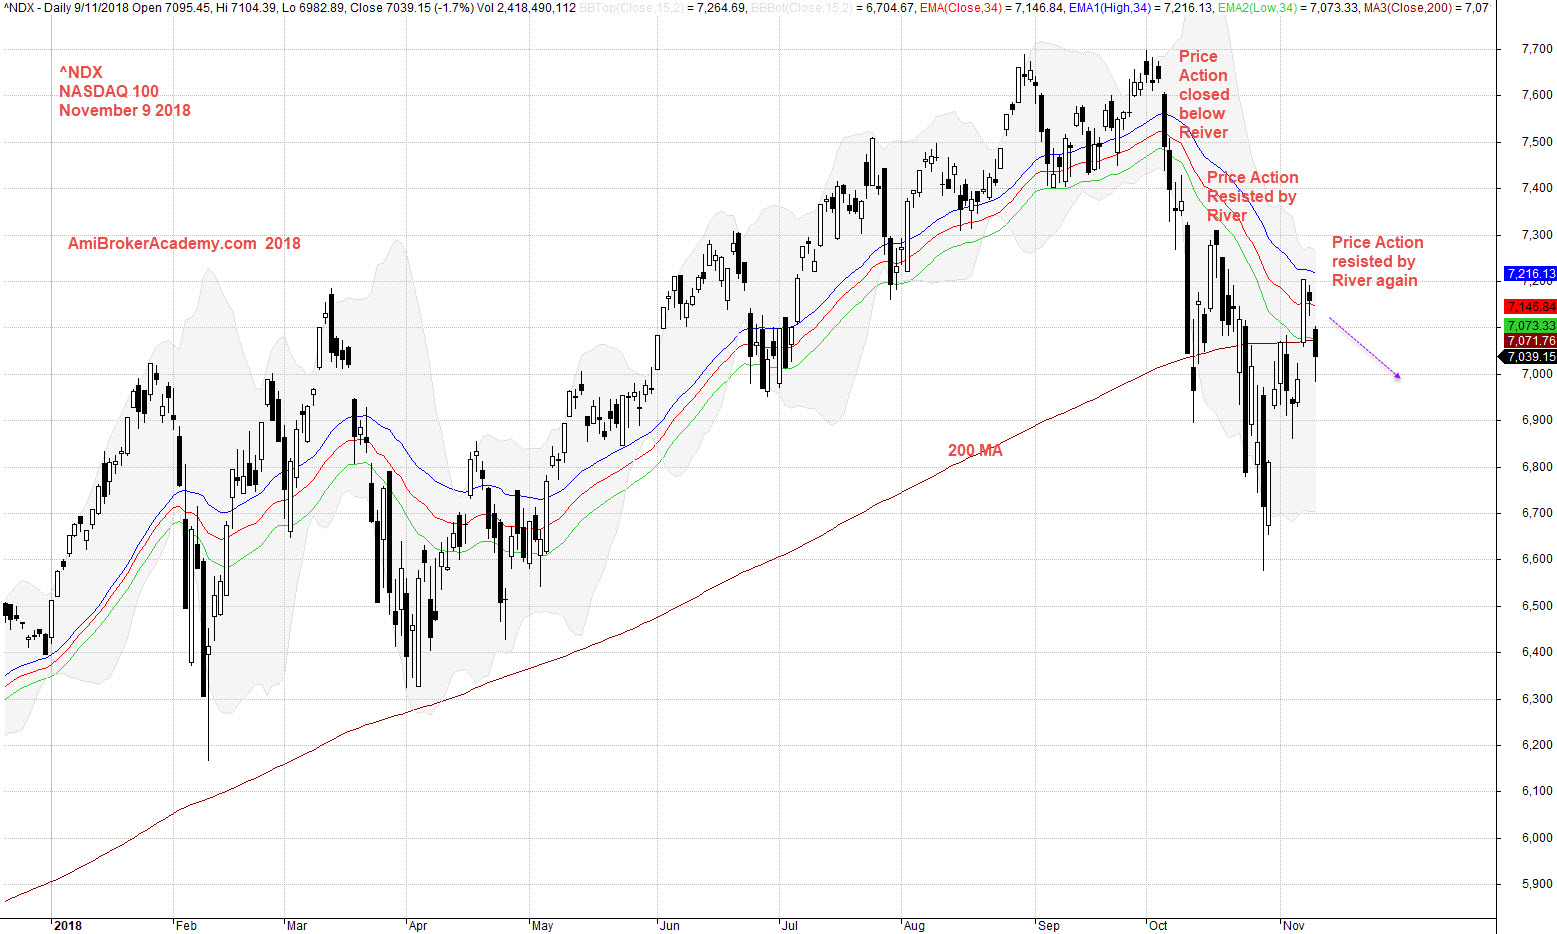
November 9, 2018 NASDAQ 100 Index and River
Moses US Stock Chart Analysis
AmiBrokerAcademy.com
Disclaimer
The above result is for illustration purpose. It is not meant to be used for buy or sell decision. We do not recommend any particular stocks. If particular stocks of such are mentioned, they are meant as demonstration of Amibroker as a powerful charting software and MACD. Amibroker can program to scan the stocks for buy and sell signals.
These are script generated signals. Not all scan results are shown here. The MACD signal should use with price action. Users must understand what MACD and price action are all about before using them. If necessary you should attend a course to learn more on Technical Analysis (TA) and Moving Average Convergence Divergence, MACD.
Once again, the website does not guarantee any results or investment return based on the information and instruction you have read here. It should be used as learning aids only and if you decide to trade real money, all trading decision should be your own.