5 February, 2019
Today is the first day of Chinese Lunar New Year. Chinese celebrate New Year for fifteen (15) days.

Welcome to AmiBrokerAcademy.com. We provide US stock analysis for academy learning.
Think!
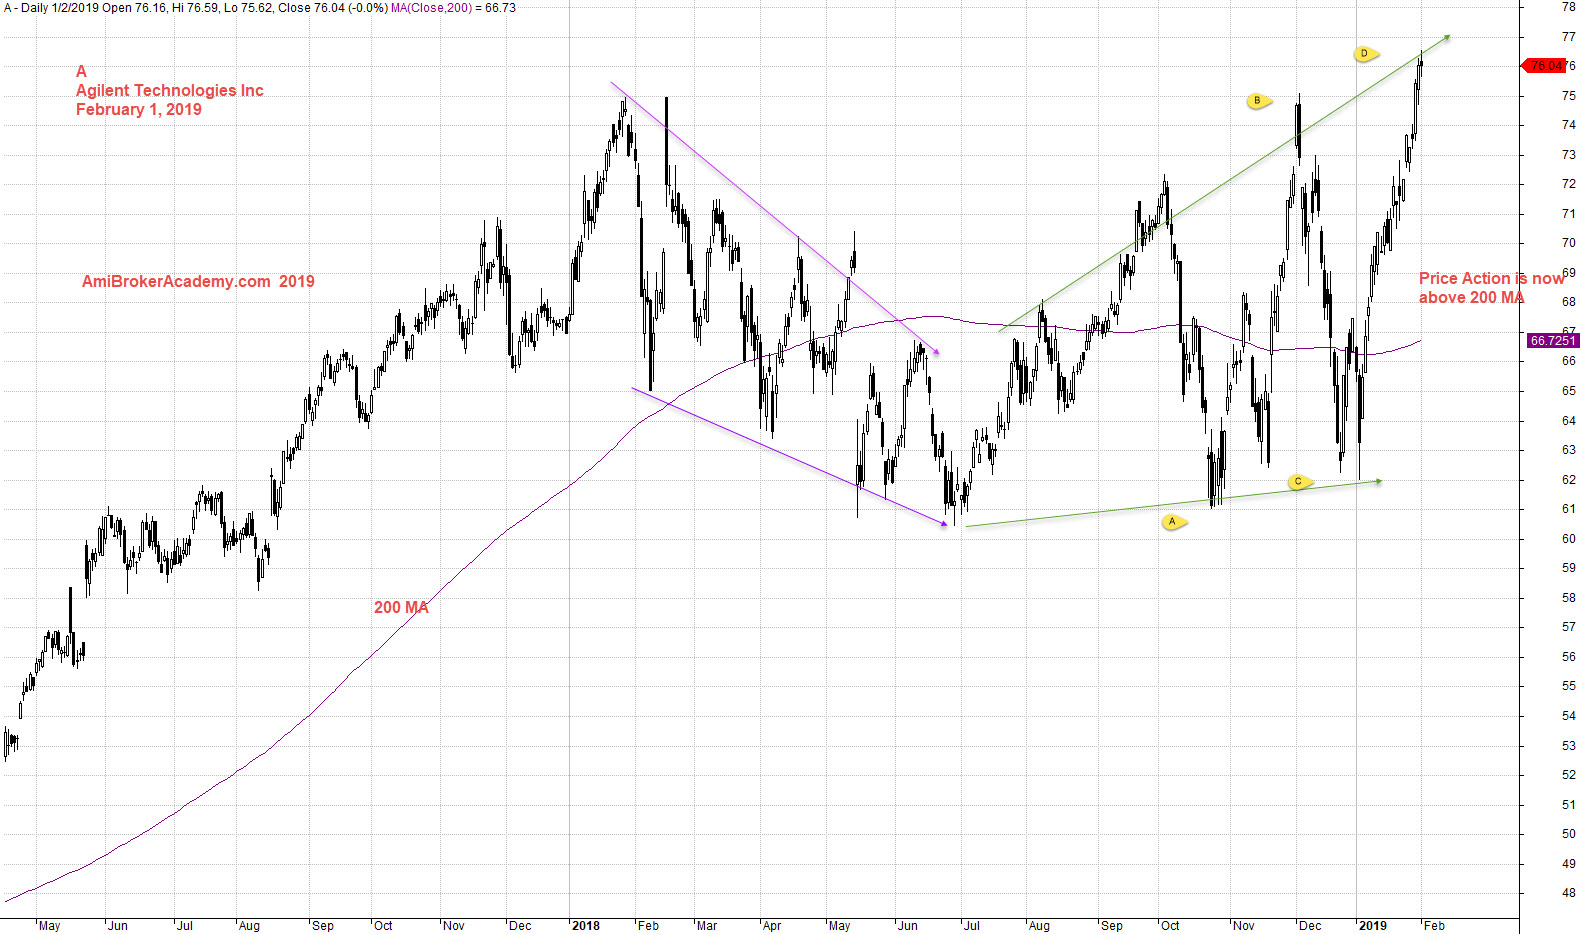
A Agilent Technologies Inc Stock Charting
Study another High Tech company such as Agilent Technologies Inc stock chart.
Picture worth a thousand words, see chart.
Use 200 MA. The price action was above 200 MA until April last year. the price action begin to cross below 200 MA. The price action rebouce up above 200 MA.
200 MA from slopping up to go flat. Price action zigzag above and below 200 MA.
See also, the H M Gartley pattern.
Trade with eyes open.
Moses Stock Analysis
AmiBrokerAcademy.com
Disclaimer
The above result is for illustration purpose. It is not meant to be used for buy or sell decision. We do not recommend any particular stocks. If particular stocks of such are mentioned, they are meant as demonstration of Amibroker as a powerful charting software and MACD. Amibroker can program to scan the stocks for buy and sell signals.
These are script generated signals. Not all scan results are shown here. The MACD signal should use with price action. Users must understand what MACD and price action are all about before using them. If necessary you should attend a course to learn more on Technical Analysis (TA) and Moving Average Convergence Divergence, MACD.
Once again, the website does not guarantee any results or investment return based on the information and instruction you have read here. It should be used as learning aids only and if you decide to trade real money, all trading decision should be your own.