July 8, 2017
Market Worry The Stock Price is Topping
Six Months Stock Performance
We have just completed half year mark of 2017, let’s look back to see what is the share price perform to plan for the next six months. Have fun!
AMZN and Amazon.com Inc First Half of 2017 Share Price Performance
Picture worth a thousand words.
Is the share price topping? Well, chart say it all. The share price has fail to break higher than 1020 dollar resistance.
We see the stock works hard in the start of 2017, forming a narrow channel and breakout higher. The price retest the support, the May low.
In April, the price action race with Google to see who will come in first to break the 1000 dollars resistance. And the result was clear, Amazon.Inc manage to breakout 1000 dollars resistance. See chart for more.
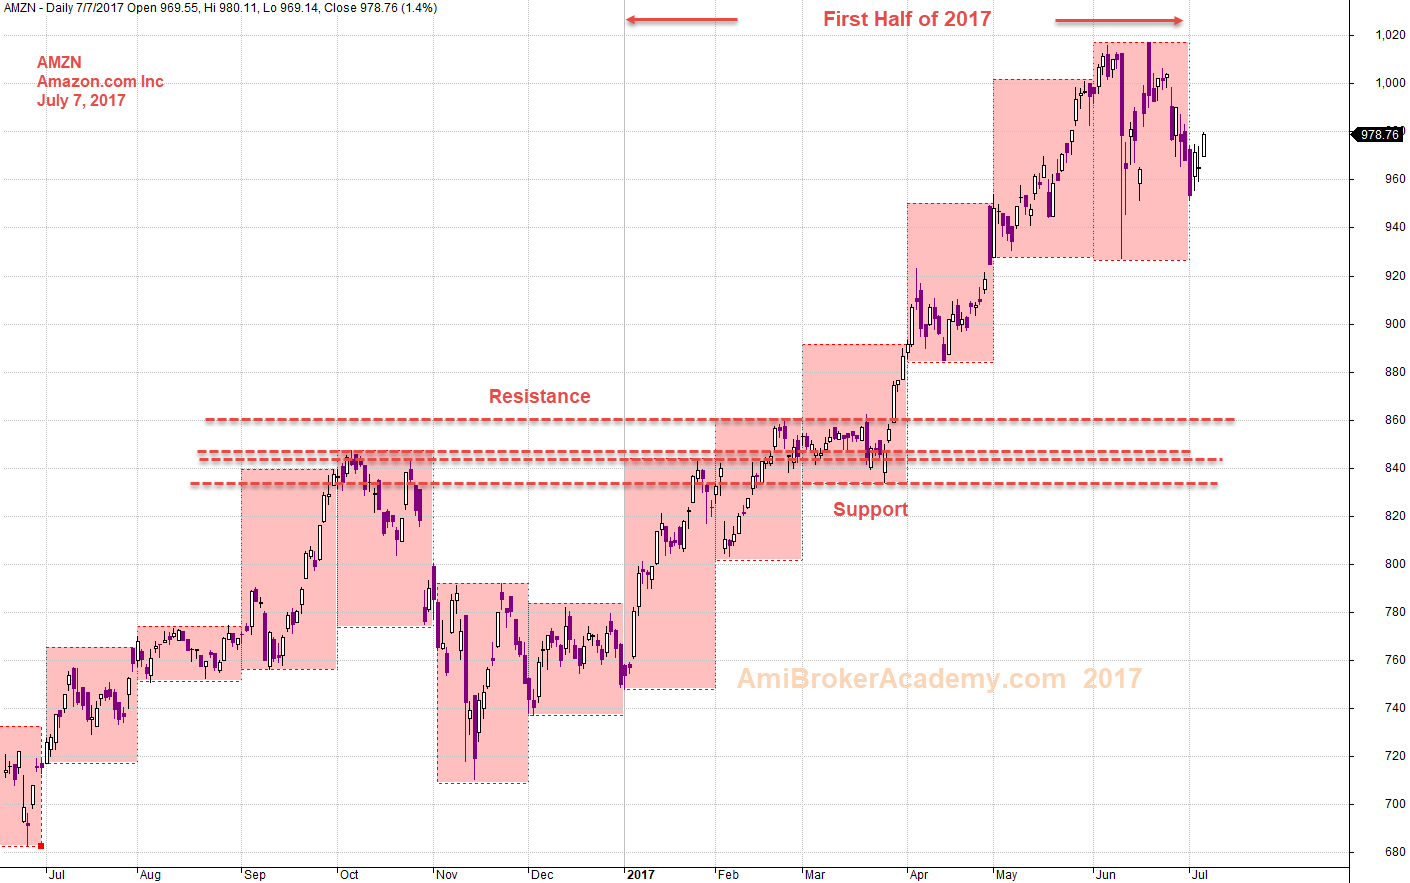
July 7, 2017 Amazon.com Inc and Support Resistance
Amazon.com Inc and MACD Signals
Share price and MACD move in the same direction.
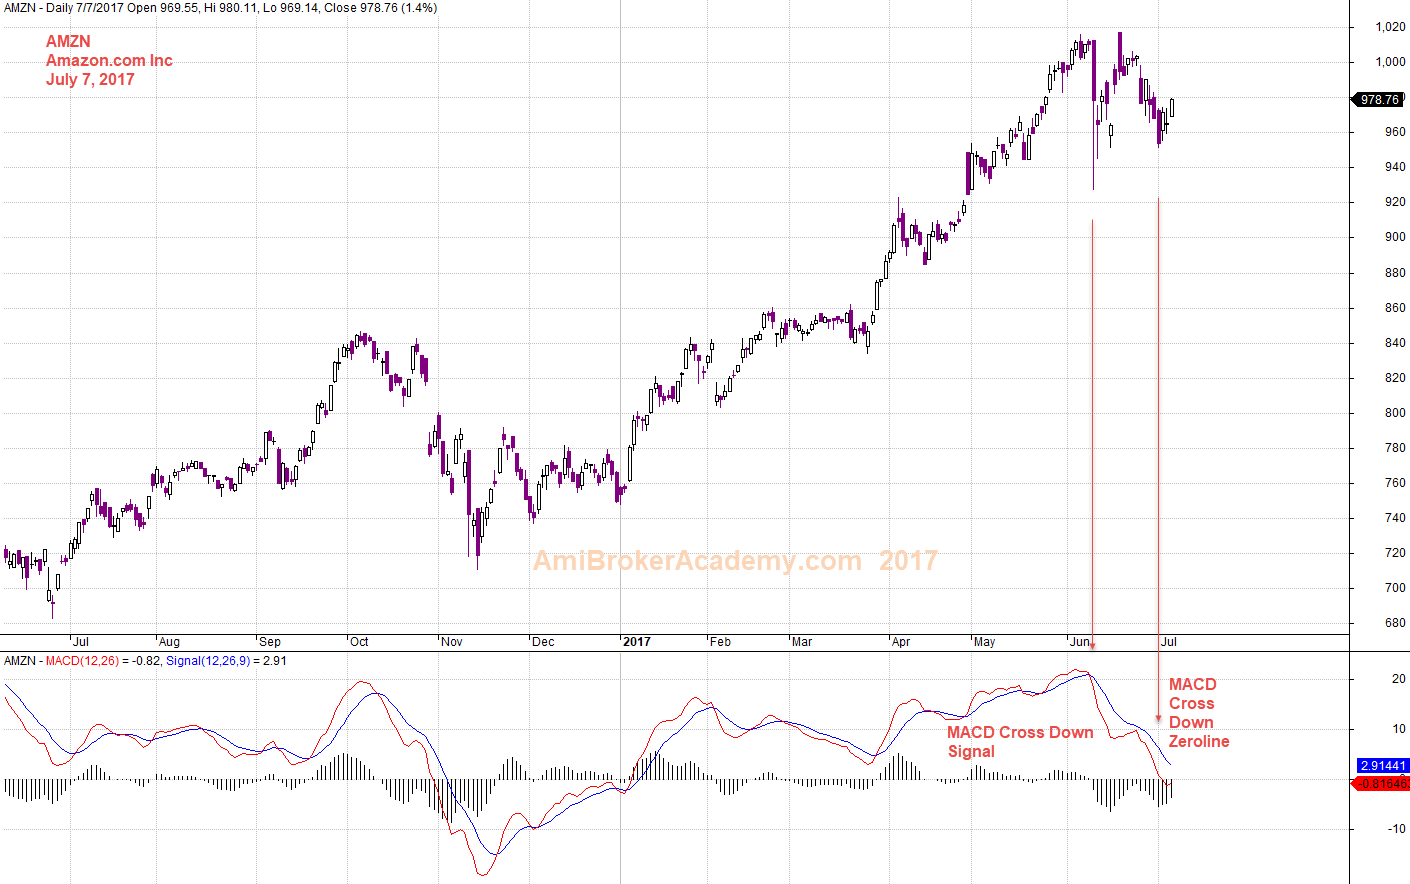
July 7, 2017 Amazon.com Inc and MACD Signals
Amazon.com and Channel
If you are here often enough, you know what we at chart differently.
You can see the price action moves in layer.
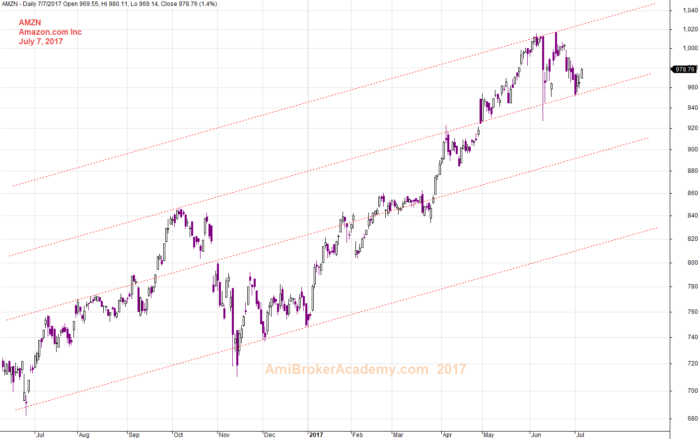
July 7, 2017 Amazon.com Inc and Channel
AMZN and Six Months Channels
The channel gives you layer by layer information, when you break up the analysis into every few months, example every six months. You see a different picture. See below for more.
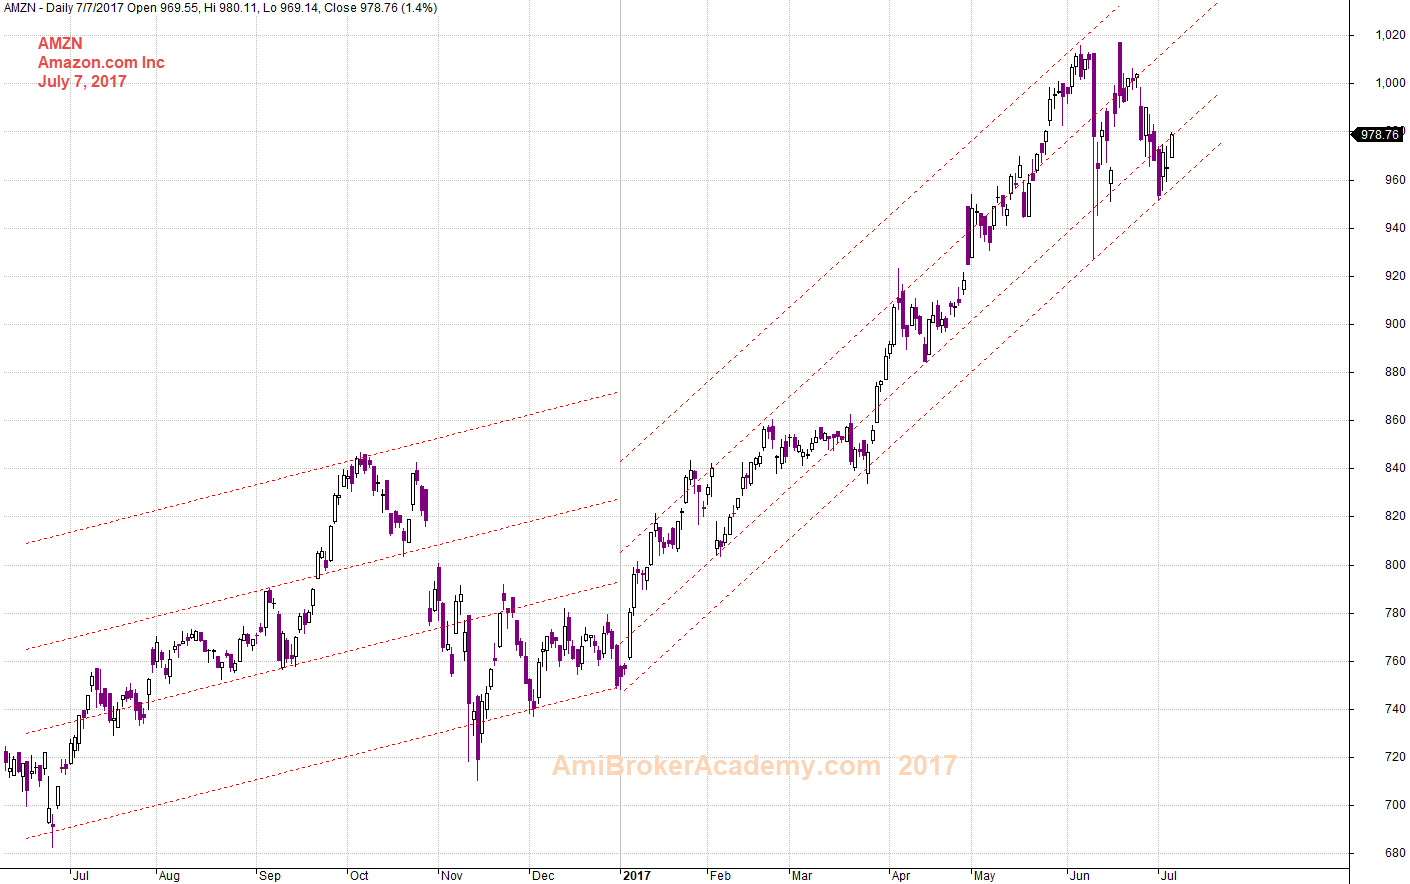
July 7, 2017 Amazon.com Inc and Six Months Channels
Risk
If you can wait, remember professional likes to wait for retracement. This will minimize the risk, as your stop loss will be smaller. So, picture worth a thousand words. In this case study, if you wait for pullback, you will have a handson gain; you can enjoy a big move in short time. Waw!
Professional Try Not to Buy and Sell Higher!
Professional trade on retracement.
What if you thought you miss and you jump in. You may be ended up you can not sleep for a days. … As you might be buy high and expecting to sell higher.
Moses
AmiBrokerAcademy.com
Disclaimer
The above result is for illustration purpose. It is not meant to be used for buy or sell decision. We do not recommend any particular stocks. If particular stocks of such are mentioned, they are meant as demonstration of Amibroker as a powerful charting software and MACD. Amibroker can program to scan the stocks for buy and sell signals.
These are script generated signals. Not all scan results are shown here. The MACD signal should use with price action. Users must understand what MACD and price action are all about before using them. If necessary you should attend a course to learn more on Technical Analysis (TA) and Moving Average Convergence Divergence, MACD.
Once again, the website does not guarantee any results or investment return based on the information and instruction you have read here. It should be used as learning aids only and if you decide to trade real money, all trading decision should be your own.