April 3, 2019
Welcome to AmiBrokerAcademy.com. Thanks for visiting the site.
It is good that you do see the same thing as us here. Have fun!
The analysis here is what we build from the knowledge gained from reading hundred and hundred of chart.
Through them we gained deeper understanding of the price action.
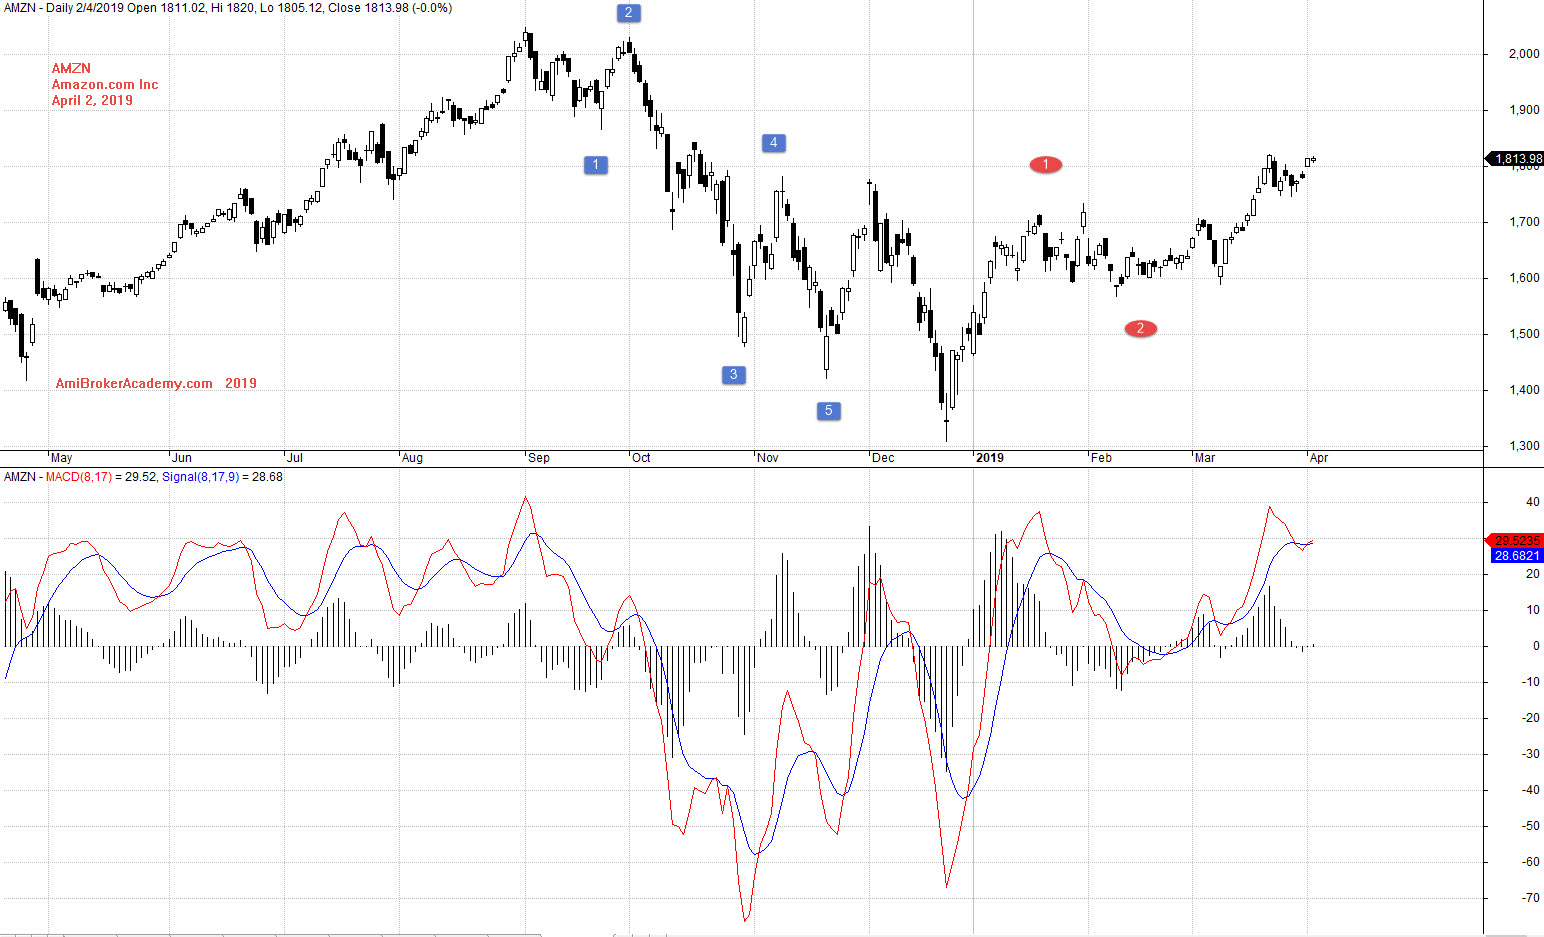
AMZN Amazon.com Inc Stock Charting
Study Amazon.com Inc Stock chart and MACD Indicator.
See chart, picture worth a thousand words.
Do you see the wave count on the chart? We just count the major turning. Elliott Wave or not does not really our focus.
See the MACD indicator, MACD has cross down zeroline and rejected.
Trade with your eyes open.
Moses Stock Observation
Moses Stock Analysis
AmiBrokerAcademy.com
Disclaimer
Disclaimer
The above result is for illustration purpose. It is not meant to be used for buy or sell decision. We do not recommend any particular stocks. If particular stocks of such are mentioned, they are meant as demonstration of Amibroker as a powerful charting software and MACD. Amibroker can program to scan the stocks for buy and sell signals.
These are script generated signals. Not all scan results are shown here. The MACD signal should use with price action. Users must understand what MACD and price action are all about before using them. If necessary you should attend a course to learn more on Technical Analysis (TA) and Moving Average Convergence Divergence, MACD.
Once again, the website does not guarantee any results or investment return based on the information and instruction you have read here. It should be used as learning aids only and if you decide to trade real money, all trading decision should be your own.