September 13, 2018
Thanks for visiting the site.
Free U.S. Stock MACD Scan
What is MACD?
MACD stands for Moving Average Convergence Divergence, common setting is (12,26,9)
MACD indicator is a trend trading system that makes up of 2 lines. The MACD Line (fast line) and MACD Signal Line (slow line).
1) When the MACD Line crosses over the MACD Signal Line the trend is bullish. When the MACD Line crosses below the MACD Signal the trend is bearish.
2) When the MACD Line crosses above zero line the trend is bullish. When the MACD line crosses below zero line the trend is bearish.
Example of MACD Signal – Walgreens Boots Alliance Inc
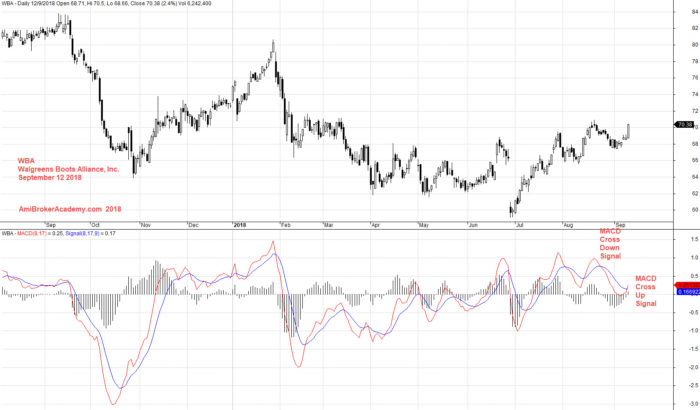
September 12, 2018 Walgreens Boots Alliance Inc and MACD
September 12 2018 – Script Generated One-day U.S. Stock MACD Signals
The following are script generated One-day U.S. Stock Market MACD signals using the Powerful AmiBroker’s AFL.
The MACD Setting used is (8,17,9)
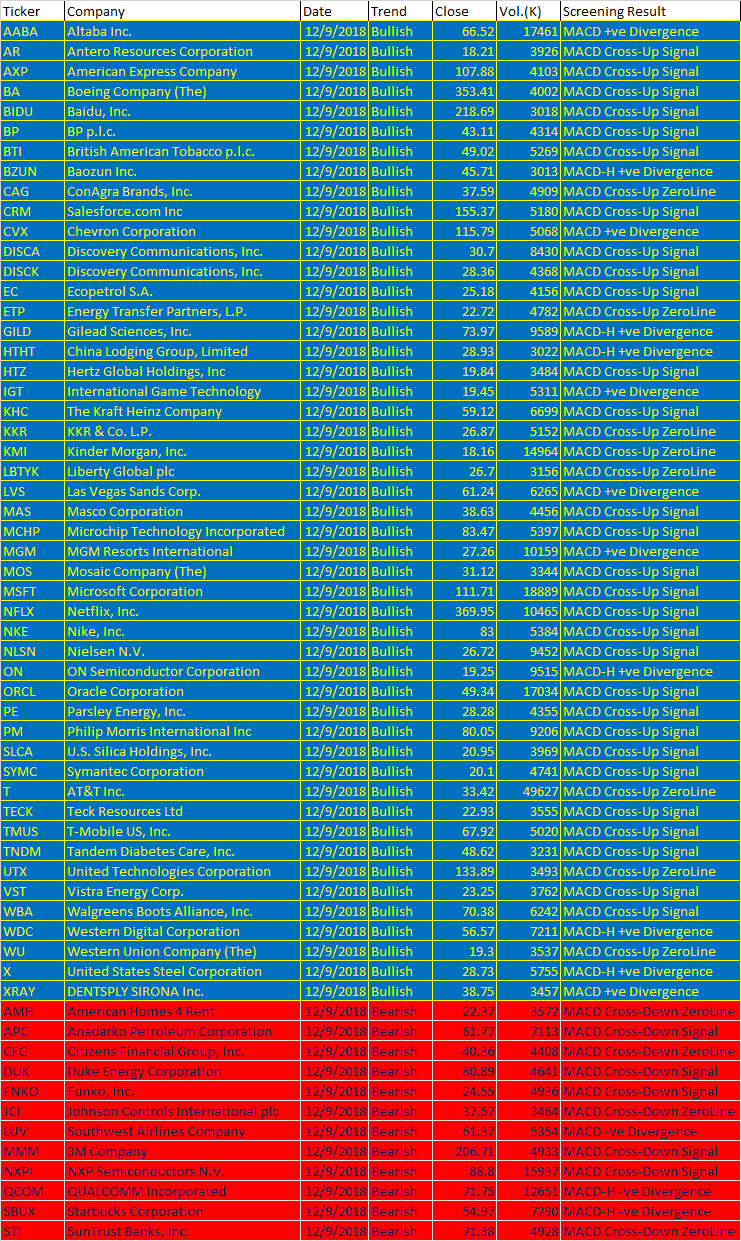
September 12, 2018 US Stock One-day MACD Screener Results
| Ticker | Company | Date | Trend | Close | Vol.(K) | Screening Result |
| AABA | Altaba Inc. | 12/9/2018 | Bullish | 66.52 | 17461 | MACD +ve Divergence |
| AR | Antero Resources Corporation | 12/9/2018 | Bullish | 18.21 | 3926 | MACD Cross-Up Signal |
| AXP | American Express Company | 12/9/2018 | Bullish | 107.88 | 4103 | MACD Cross-Up Signal |
| BA | Boeing Company (The) | 12/9/2018 | Bullish | 353.41 | 4002 | MACD Cross-Up Signal |
| BIDU | Baidu, Inc. | 12/9/2018 | Bullish | 218.69 | 3018 | MACD Cross-Up Signal |
| BP | BP p.l.c. | 12/9/2018 | Bullish | 43.11 | 4314 | MACD Cross-Up Signal |
| BTI | British American Tobacco p.l.c. | 12/9/2018 | Bullish | 49.02 | 5269 | MACD Cross-Up Signal |
| BZUN | Baozun Inc. | 12/9/2018 | Bullish | 45.71 | 3013 | MACD-H +ve Divergence |
| CAG | ConAgra Brands, Inc. | 12/9/2018 | Bullish | 37.59 | 4909 | MACD Cross-Up ZeroLine |
| CRM | Salesforce.com Inc | 12/9/2018 | Bullish | 155.37 | 5180 | MACD Cross-Up Signal |
| CVX | Chevron Corporation | 12/9/2018 | Bullish | 115.79 | 5068 | MACD +ve Divergence |
| DISCA | Discovery Communications, Inc. | 12/9/2018 | Bullish | 30.7 | 8430 | MACD Cross-Up Signal |
| DISCK | Discovery Communications, Inc. | 12/9/2018 | Bullish | 28.36 | 4368 | MACD Cross-Up Signal |
| EC | Ecopetrol S.A. | 12/9/2018 | Bullish | 25.18 | 4156 | MACD Cross-Up Signal |
| ETP | Energy Transfer Partners, L.P. | 12/9/2018 | Bullish | 22.72 | 4782 | MACD Cross-Up ZeroLine |
| GILD | Gilead Sciences, Inc. | 12/9/2018 | Bullish | 73.97 | 9589 | MACD-H +ve Divergence |
| HTHT | China Lodging Group, Limited | 12/9/2018 | Bullish | 28.93 | 3022 | MACD-H +ve Divergence |
| HTZ | Hertz Global Holdings, Inc | 12/9/2018 | Bullish | 19.84 | 3484 | MACD Cross-Up Signal |
| IGT | International Game Technology | 12/9/2018 | Bullish | 19.45 | 5311 | MACD +ve Divergence |
| KHC | The Kraft Heinz Company | 12/9/2018 | Bullish | 59.12 | 6699 | MACD Cross-Up Signal |
| KKR | KKR & Co. L.P. | 12/9/2018 | Bullish | 26.87 | 5152 | MACD Cross-Up ZeroLine |
| KMI | Kinder Morgan, Inc. | 12/9/2018 | Bullish | 18.16 | 14964 | MACD Cross-Up ZeroLine |
| LBTYK | Liberty Global plc | 12/9/2018 | Bullish | 26.7 | 3156 | MACD Cross-Up ZeroLine |
| LVS | Las Vegas Sands Corp. | 12/9/2018 | Bullish | 61.24 | 6265 | MACD +ve Divergence |
| MAS | Masco Corporation | 12/9/2018 | Bullish | 38.63 | 4456 | MACD Cross-Up Signal |
| MCHP | Microchip Technology Incorporated | 12/9/2018 | Bullish | 83.47 | 5397 | MACD Cross-Up Signal |
| MGM | MGM Resorts International | 12/9/2018 | Bullish | 27.26 | 10159 | MACD +ve Divergence |
| MOS | Mosaic Company (The) | 12/9/2018 | Bullish | 31.12 | 3344 | MACD Cross-Up Signal |
| MSFT | Microsoft Corporation | 12/9/2018 | Bullish | 111.71 | 18889 | MACD Cross-Up Signal |
| NFLX | Netflix, Inc. | 12/9/2018 | Bullish | 369.95 | 10465 | MACD Cross-Up Signal |
| NKE | Nike, Inc. | 12/9/2018 | Bullish | 83 | 5384 | MACD Cross-Up Signal |
| NLSN | Nielsen N.V. | 12/9/2018 | Bullish | 26.72 | 9452 | MACD Cross-Up Signal |
| ON | ON Semiconductor Corporation | 12/9/2018 | Bullish | 19.25 | 9515 | MACD-H +ve Divergence |
| ORCL | Oracle Corporation | 12/9/2018 | Bullish | 49.34 | 17034 | MACD Cross-Up Signal |
| PE | Parsley Energy, Inc. | 12/9/2018 | Bullish | 28.28 | 4355 | MACD Cross-Up Signal |
| PM | Philip Morris International Inc | 12/9/2018 | Bullish | 80.05 | 9206 | MACD Cross-Up Signal |
| SLCA | U.S. Silica Holdings, Inc. | 12/9/2018 | Bullish | 20.95 | 3969 | MACD Cross-Up Signal |
| SYMC | Symantec Corporation | 12/9/2018 | Bullish | 20.1 | 4741 | MACD Cross-Up Signal |
| T | AT&T Inc. | 12/9/2018 | Bullish | 33.42 | 49627 | MACD Cross-Up ZeroLine |
| TECK | Teck Resources Ltd | 12/9/2018 | Bullish | 22.93 | 3555 | MACD Cross-Up Signal |
| TMUS | T-Mobile US, Inc. | 12/9/2018 | Bullish | 67.92 | 5020 | MACD Cross-Up Signal |
| TNDM | Tandem Diabetes Care, Inc. | 12/9/2018 | Bullish | 48.62 | 3231 | MACD Cross-Up Signal |
| UTX | United Technologies Corporation | 12/9/2018 | Bullish | 133.89 | 3493 | MACD Cross-Up ZeroLine |
| VST | Vistra Energy Corp. | 12/9/2018 | Bullish | 23.25 | 3762 | MACD Cross-Up Signal |
| WBA | Walgreens Boots Alliance, Inc. | 12/9/2018 | Bullish | 70.38 | 6242 | MACD Cross-Up Signal |
| WDC | Western Digital Corporation | 12/9/2018 | Bullish | 56.57 | 7211 | MACD-H +ve Divergence |
| WU | Western Union Company (The) | 12/9/2018 | Bullish | 19.3 | 3537 | MACD Cross-Up ZeroLine |
| X | United States Steel Corporation | 12/9/2018 | Bullish | 28.73 | 5755 | MACD-H +ve Divergence |
| XRAY | DENTSPLY SIRONA Inc. | 12/9/2018 | Bullish | 38.75 | 3457 | MACD +ve Divergence |
| AMH | American Homes 4 Rent | 12/9/2018 | Bearish | 22.37 | 3572 | MACD Cross-Down ZeroLine |
| APC | Anadarko Petroleum Corporation | 12/9/2018 | Bearish | 61.77 | 7113 | MACD Cross-Down Signal |
| CFG | Citizens Financial Group, Inc. | 12/9/2018 | Bearish | 40.36 | 4408 | MACD Cross-Down ZeroLine |
| DUK | Duke Energy Corporation | 12/9/2018 | Bearish | 80.89 | 4641 | MACD Cross-Down Signal |
| FNKO | Funko, Inc. | 12/9/2018 | Bearish | 24.55 | 4936 | MACD Cross-Down Signal |
| JCI | Johnson Controls International plc | 12/9/2018 | Bearish | 37.57 | 3464 | MACD Cross-Down ZeroLine |
| LUV | Southwest Airlines Company | 12/9/2018 | Bearish | 61.37 | 5354 | MACD -ve Divergence |
| MMM | 3M Company | 12/9/2018 | Bearish | 206.71 | 4933 | MACD Cross-Down Signal |
| NXPI | NXP Semiconductors N.V. | 12/9/2018 | Bearish | 88.8 | 15937 | MACD Cross-Down Signal |
| QCOM | QUALCOMM Incorporated | 12/9/2018 | Bearish | 71.75 | 12651 | MACD-H -ve Divergence |
| SBUX | Starbucks Corporation | 12/9/2018 | Bearish | 54.97 | 7290 | MACD-H -ve Divergence |
| STI | SunTrust Banks, Inc. | 12/9/2018 | Bearish | 71.38 | 4928 | MACD Cross-Down ZeroLine |
Moses U.S. Stock MACD Scan
AmiBroker Academy.com
Disclaimer
The above result is for illustration purpose. It is not meant to be used for buy or sell decision. We do not recommend any particular stocks. If particular stocks of such are mentioned, they are meant as demonstration of Amibroker as a powerful charting software and MACD. Amibroker can program to scan the stocks for buy and sell signals.
These are script generated signals. Not all scan results are shown here. The MACD signal should use with price action. Users must understand what MACD and price action are all about before using them. If necessary you should attend a course to learn more on Technical Analysis (TA) and Moving Average Convergence Divergence, MACD.
Once again, the website does not guarantee any results or investment return based on the information and instruction you have read here. It should be used as learning aids only and if you decide to trade real money, all trading decision should be your own.