1 August, 2018
Singapore Stock Stories
C6L Singapore Airlines Charting and Three Years Stock Chart
See chart, picture worth a thousand words. Study Singapore Airlines, SIA stock price. See stock chart. The price action has crossed lower for the month of July. The stock price was ended 9.86 on Monday. SIA stock price spike up in July, and ended lower than the July month opening price, why? This would be very much a fundamental question. The company has announced number of direct flight from Singapore to US. But what does that mean to many, this has to be from Singapore. Are many businessman from Singapore to USA? Not from the Singapore businessman, as for the Asia Pacific, then these business people has to flight in first to Singapore than go USA. Who is going to pay for the flying in?
Will not the company, so do not understand the strategy behind this rout of the direct flight. Some of the strategy planner must be having different mega data on the success of these direct flight.
SIA stock price is back down near to the 2015 low. Monitor your trade and risk.
What will the the price action like for the next few days or weeks or maybe months? Can the stock price reverse? See our ABCD pattern chart, it will but the price has to go lower some more.
Remember, this is just our technical analysis and understand. Have your financial adviser to guide your. You just believe in our thinking out loud. Besides that all setup can fail.
Manage your risk.
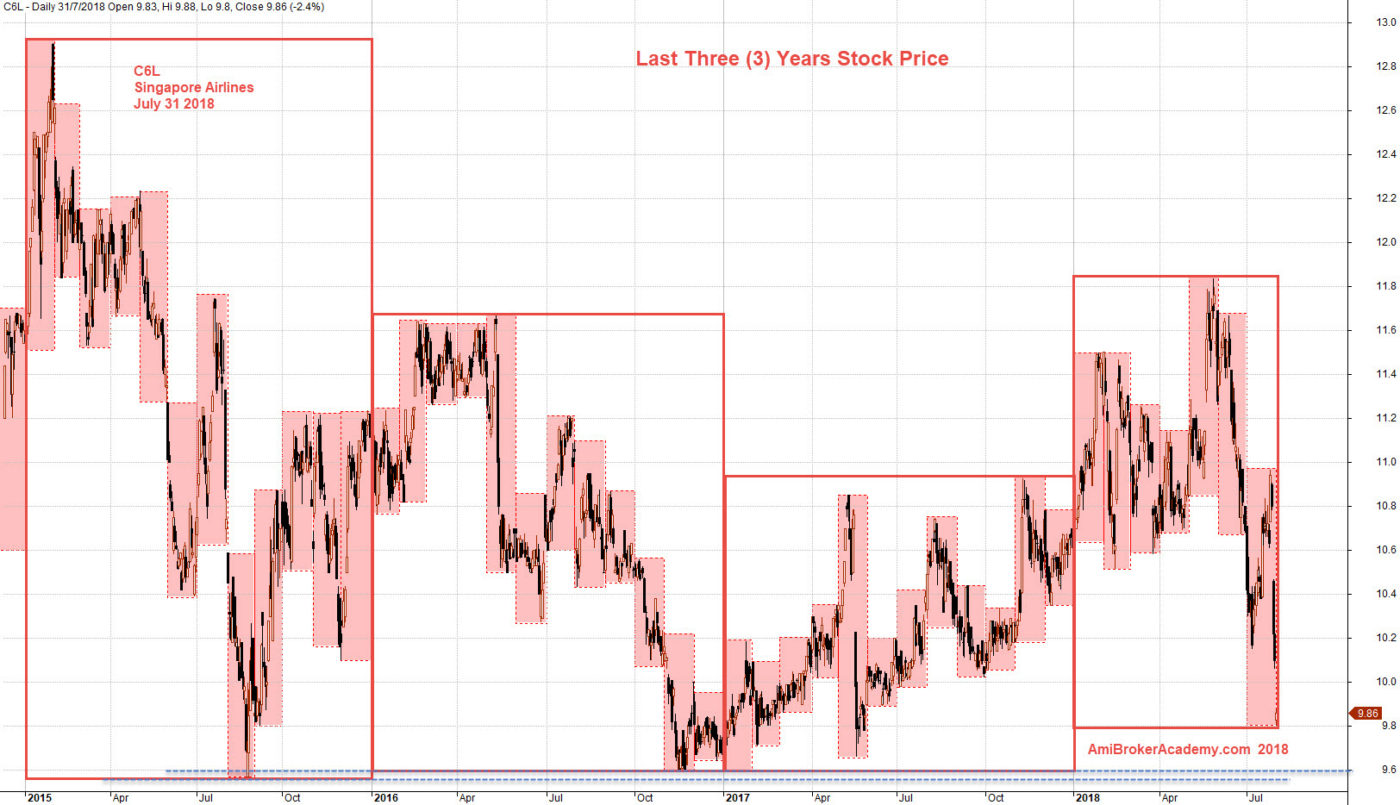
July 31, 2018 Singapore Airlines Three Years Stock Chart
C6L SIA Charting and ABCD Buy Pattern
See chart, picture worth a thousand words. H M Gartley ABCD buy pattern, the stock price is in the process of competing the AB=CD leg. Trade with eyes open and manage your trade.
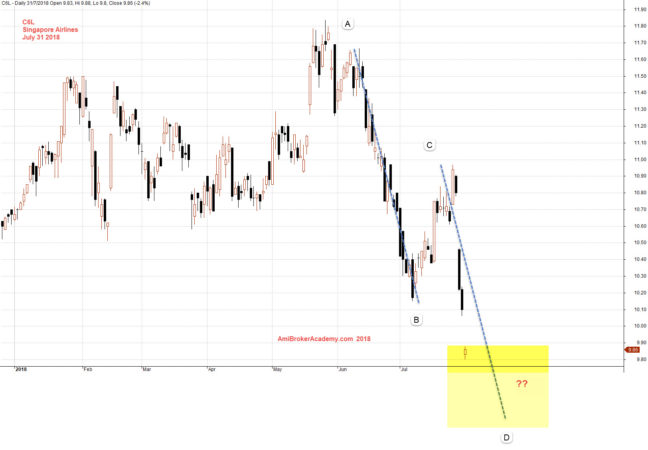
July 31, 2018 Singapore Airlines and ABCD
Zoom Out C6L SIA Charting and Six Months Performance
Picture worth a thousand words, see chart. the stock price has breakout from the two quarters high, or resistance. The stock price pullback to retest the level again for support, and then for resistance. Now the stock price is in the process to complete the CD leg.
Trade with your eyes open. Manage your risk.
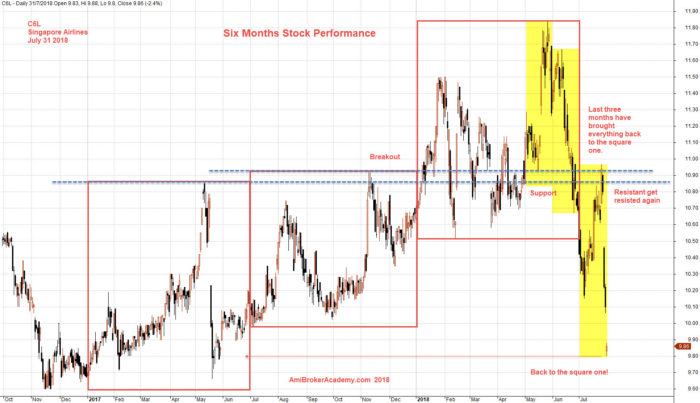
July 31, 2018 Singapore Airlines Six Months Performance
Manage your trade and risk.
Moses
AmiBrokerAcademy.com
Disclaimer
The above result is for illustration purpose. It is not meant to be used for buy or sell decision. We do not recommend any particular stocks. If particular stocks of such are mentioned, they are meant as demonstration of Amibroker as a powerful charting software and MACD. Amibroker can program to scan the stocks for buy and sell signals.
These are script generated signals. Not all scan results are shown here. The MACD signal should use with price action. Users must understand what MACD and price action are all about before using them. If necessary you should attend a course to learn more on Technical Analysis (TA) and Moving Average Convergence Divergence, MACD.
Once again, the website does not guarantee any results or investment return based on the information and instruction you have read here. It should be used as learning aids only and if you decide to trade real money, all trading decision should be your own.