April 20, 2017
Ellipsiz and MACD Indicator
The price may touch the upper channel and further the chart pattern may turn out to be bullish flag.
See there is resistant to stop the MACD line goes below zeroline.
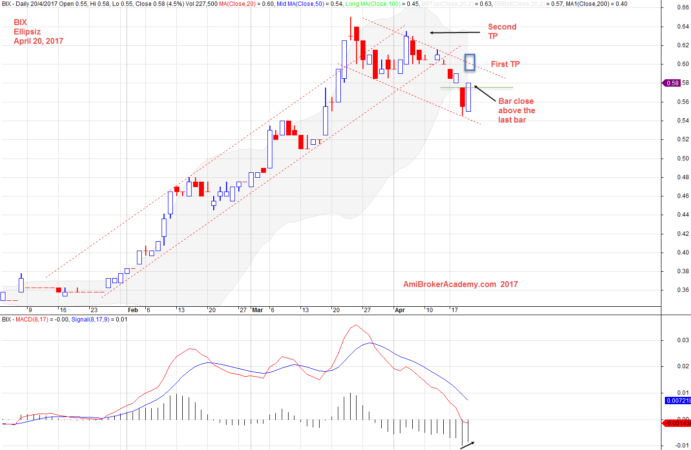
April 20, 2017 Ellipsiz and MACD Indicator
Ellipsiz and MACD Indicator
Can the wave support the fall? We see the price trapped in the wave.
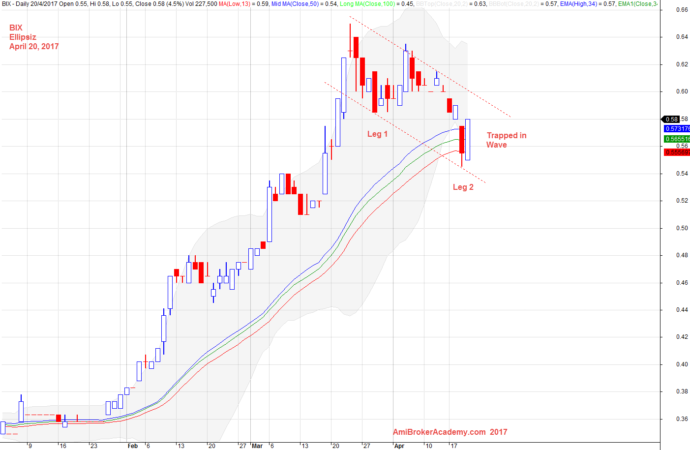
April 20, 2017 Ellipsiz and 34 EMA Wave
Moses Stock Analysis
AmiBrokerAcademy.com
Disclaimer
The above result is for illustration purpose. It is not meant to be used for buy or sell decision. We do not recommend any particular stocks. If particular stocks of such are mentioned, they are meant as demonstration of Amibroker as a powerful charting software and MACD. Amibroker can program to scan the stocks for buy and sell signals.
These are script generated signals. Not all scan results are shown here. The MACD signal should use with price action. Users must understand what MACD and price action are all about before using them. If necessary you should attend a course to learn more on Technical Analysis (TA) and Moving Average Convergence Divergence, MACD.
Once again, the website does not guarantee any results or investment return based on the information and instruction you have read here. It should be used as learning aids only and if you decide to trade real money, all trading decision should be your own.