November 20, 2018
Thanks for visiting the site.
There is a reason for everything. Perhaps at the moment you do not have the answer.
Moses Stock Analysis
1B0 MM2 Asia Stock Charting
Buy low sell high, buy support sell resistance.
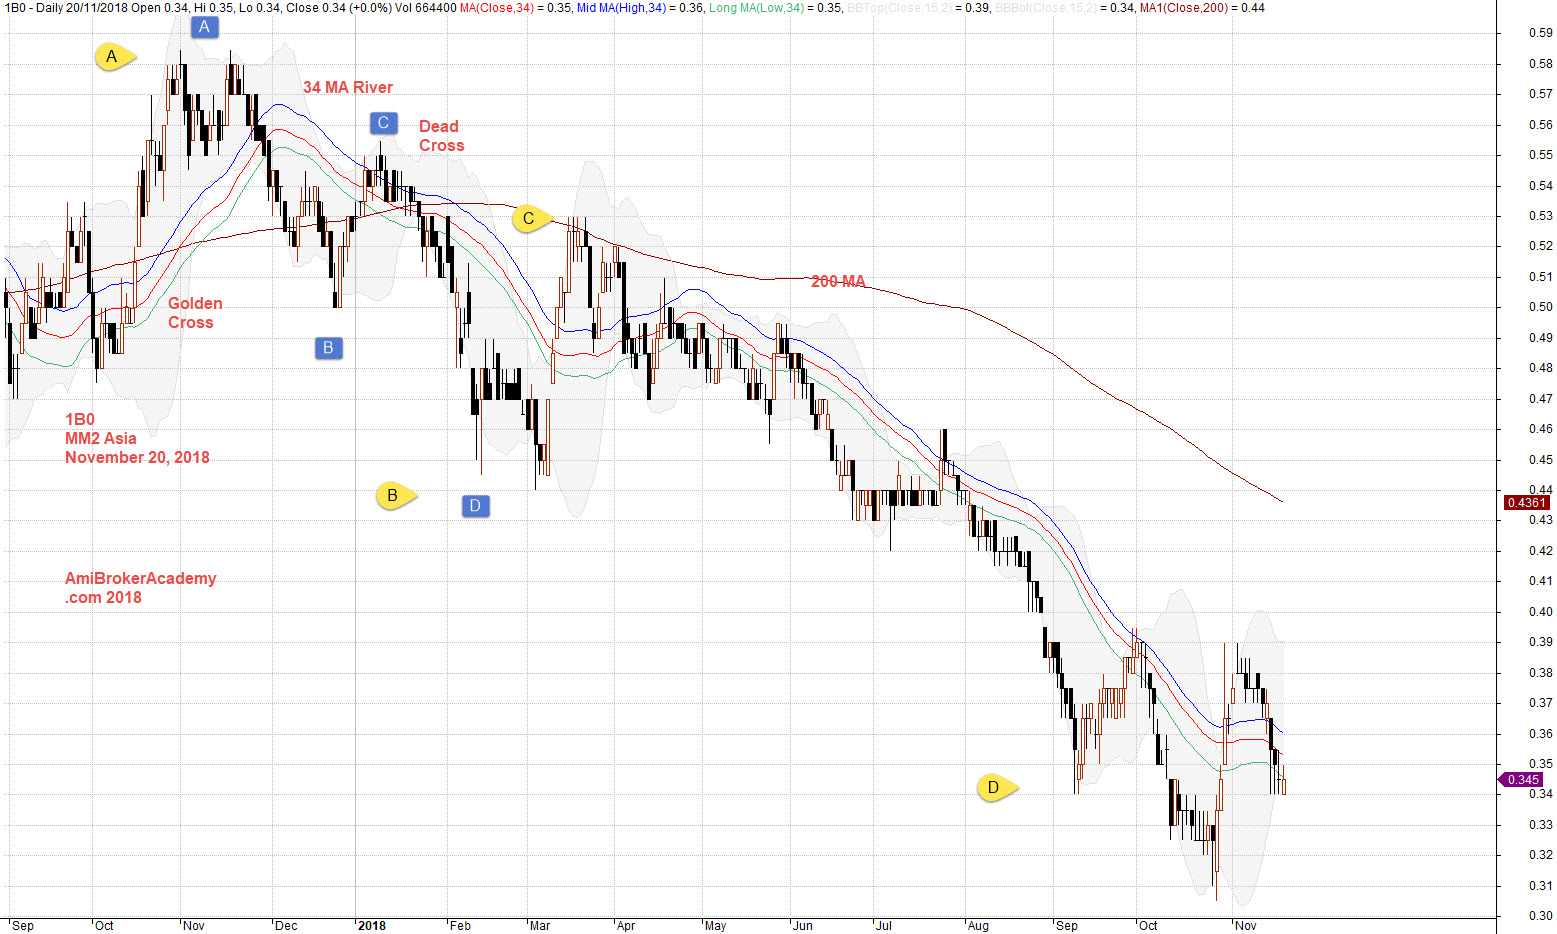
See chart, the price action of MM2 Asia stock chart.
Apply buy low sell high and buy hold strategy. The price action after test near 59 cents the price action begin to lost the drive to push up move higher. The price follow H M Gartley pattern to drift south and south and south. The price action start with golden cross ended dead cross. The price action begin to stay below River, and resisted by the 200 MA. See the visual tool, MA. The fast ma points south and wide apart from the slow ma. See chart, picture worth a thousand words.
Trade with eyes open, manage your risk.
November 20, 2018 MM2 Asia and MACD
Moses
AmiBrokerAcademy.com
Disclaimer
The above result is for illustration purpose. It is not meant to be used for buy or sell decision. We do not recommend any particular stocks. If particular stocks of such are mentioned, they are meant as demonstration of Amibroker as a powerful charting software and MACD. Amibroker can program to scan the stocks for buy and sell signals.
These are script generated signals. Not all scan results are shown here. The MACD signal should use with price action. Users must understand what MACD and price action are all about before using them. If necessary you should attend a course to learn more on Technical Analysis (TA) and Moving Average Convergence Divergence, MACD.
Once again, the website does not guarantee any results or investment return based on the information and instruction you have read here. It should be used as learning aids only and if you decide to trade real money, all trading decision should be your own.