9 November, 2019
Welcome to AmiBrokerAcademy.com. Thanks for visiting the site.
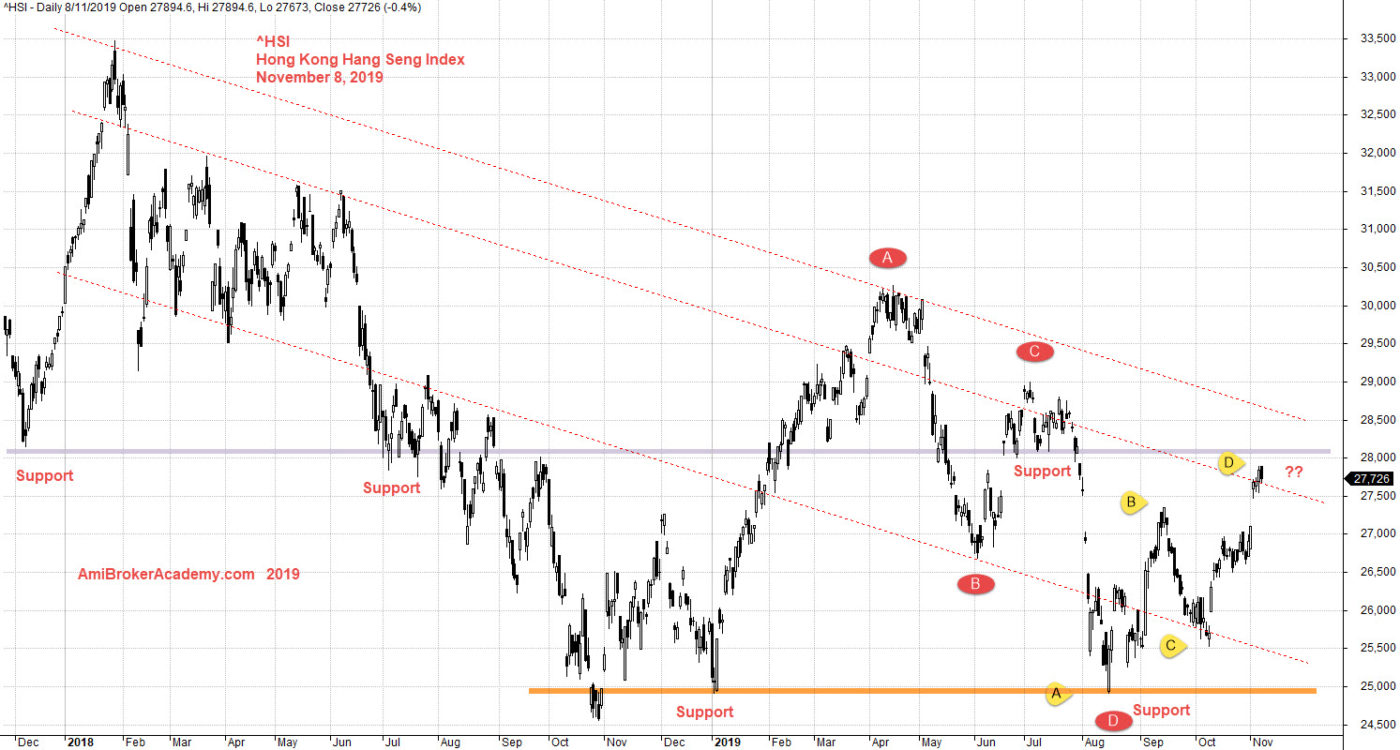
^HSI Hong Kong Hang Seng Index 香港恒生指数 Stock Charting
Look back our September analysis, we studied Hong Kong Hang Seng Index 香港恒生指数 Stock chart and see a completed bear ABCD pattern.
See chart, after the bear ABCD pattern, the pull ABCD pattern kick in and completed also.
See chart, picture worth a thousand words.
So, don’t play play, H M Gartley observation is very powerful. If you can trade the H M Gartley ABCD pattern. You will probably very beneficial financially. (Warning: If you are not trained, please seek professional advice and training before you attempt to trade.)
Add channel to see the price action and and the support resistance.
Trade with eyes open.
Moses Stock Observation
AmiBrokerAcademy.com
Disclaimer
The above result is for illustration purpose. It is not meant to be used for buy or sell decision. We do not recommend any particular stocks. If particular stocks of such are mentioned, they are meant as demonstration of Amibroker as a powerful charting software and MACD. Amibroker can program to scan the stocks for buy and sell signals.
These are script generated signals. Not all scan results are shown here. The MACD signal should use with price action. Users must understand what MACD and price action are all about before using them. If necessary you should attend a course to learn more on Technical Analysis (TA) and Moving Average Convergence Divergence, MACD.
Once again, the website does not guarantee any results or investment return based on the information and instruction you have read here. It should be used as learning aids only and if you decide to trade real money, all trading decision should be your own.