May 20, 2019
Welcome!
Welcome to AmiBrokerAcademy.com. Thanks for visiting the site.
Have fun!
AAPL Apple Inc Stock Charting
Study Apple Inc stock chart and month high low.
See chart, picture worth a thousand words.
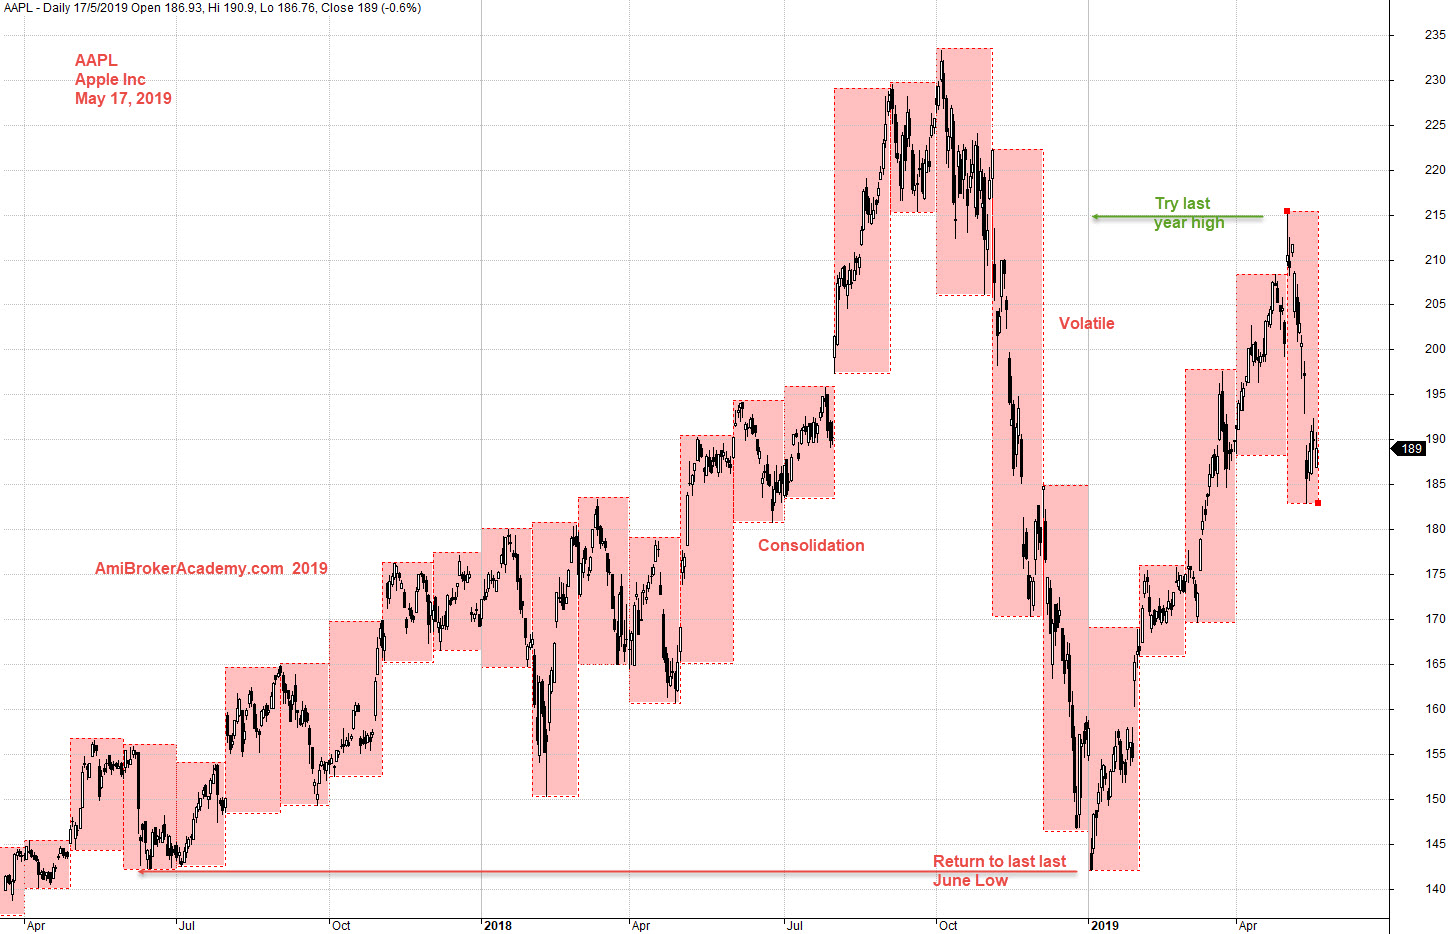
Price Action was on an up trend. After the price action test 220 dollars and try to reach for 230 dollars, the price action begin to fail and crash.
Price action returns to 2017 June low. Imagine if you apply BHS, buy hold strategy. You must feel sick, very sick. Now, the price has rebounce and try to reach the previous high, but still too short.
Trade with your eyes open.
Imagine you bought 200 Apple shares in last September at 220 dollars, it costed you 44,000 dollars. Price went near 140 dollars at January this year. You were at lost almost 16,000 dollars in three months. Although now the price has rebounced, but the stock price is still less than 220 dollars. Do you think you know anything about Apple Inc, such as Apple’s largest customers, or most important suppliers, or describe the company product raodmap. It is likely that you response with a blank expression. Well, this is perfectly normal. The only thing is you at least study the chart first. Okay, study the chart. Try buy high and expect to sell higher.
Moses Stock Observation
AmiBrokerAcademy.com
Disclaimer
The above result is for illustration purpose. It is not meant to be used for buy or sell decision. We do not recommend any particular stocks. If particular stocks of such are mentioned, they are meant as demonstration of Amibroker as a powerful charting software and MACD. Amibroker can program to scan the stocks for buy and sell signals.
These are script generated signals. Not all scan results are shown here. The MACD signal should use with price action. Users must understand what MACD and price action are all about before using them. If necessary you should attend a course to learn more on Technical Analysis (TA) and Moving Average Convergence Divergence, MACD.
Once again, the website does not guarantee any results or investment return based on the information and instruction you have read here. It should be used as learning aids only and if you decide to trade real money, all trading decision should be your own.