19 January 2021
Welcome!
Welcome to AmiBroker Academy dot com, amibrokeracademy.com. Thanks for your search and landed yourself here.
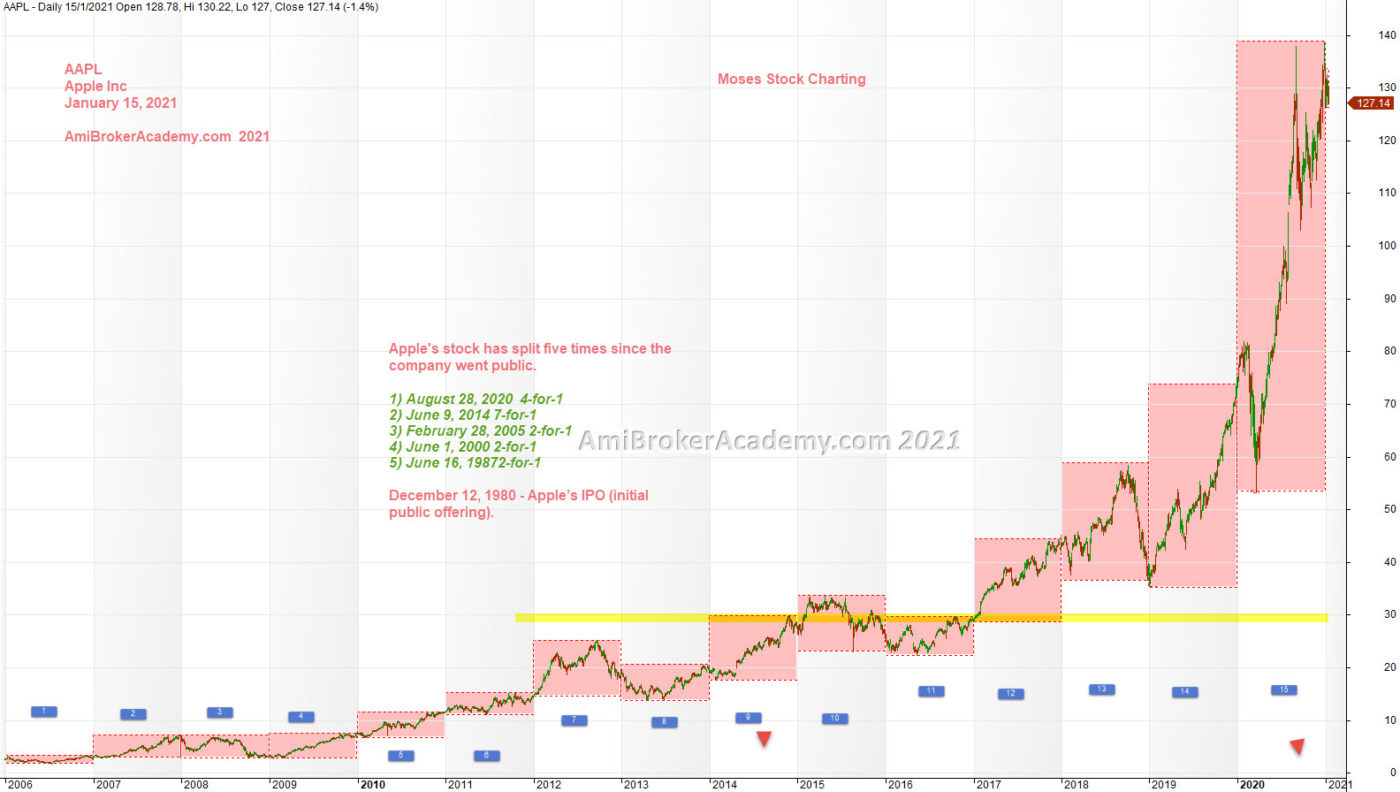
AAPL | Apple Inc and Boxes from 2006
Picture worth a thousand words.
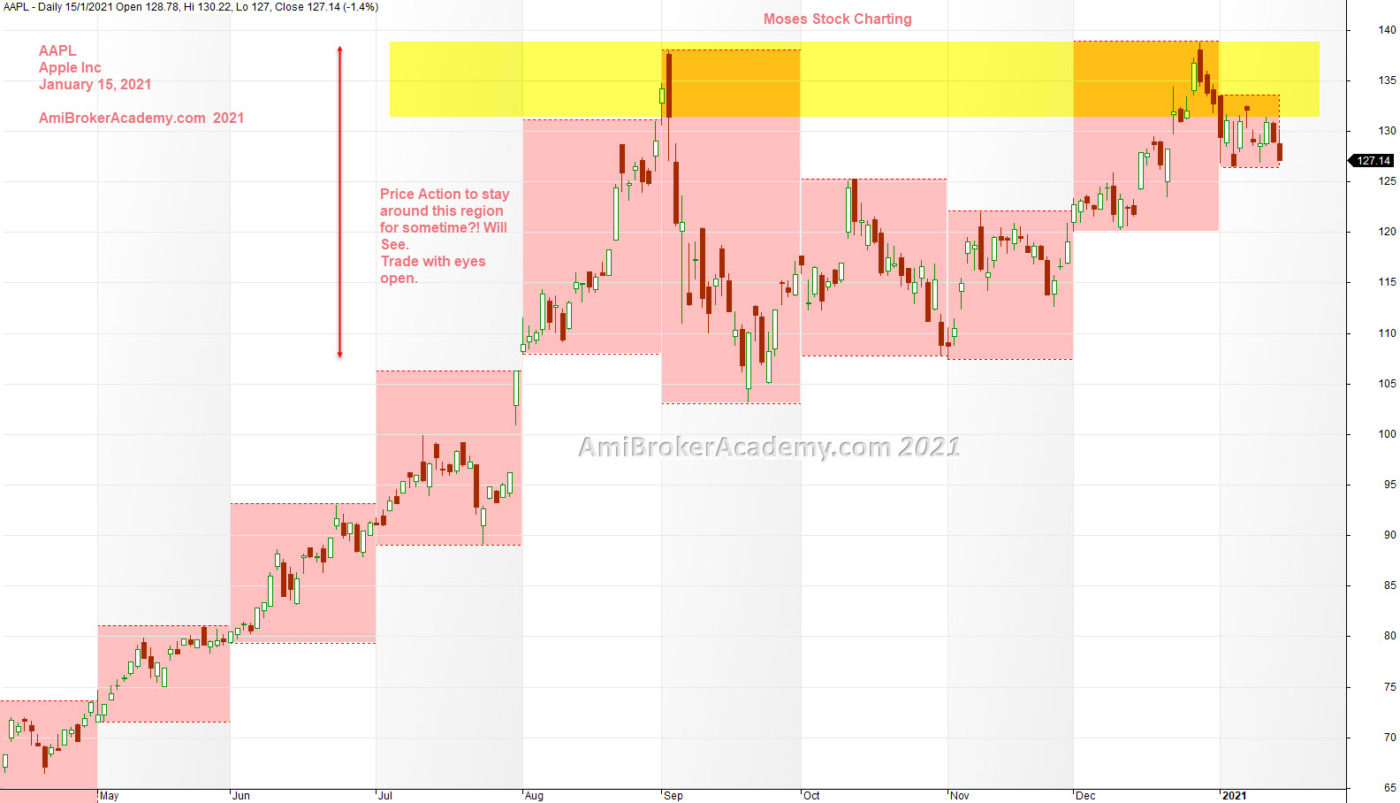
Price Action continue to move higher like walking up the staircase.
Read our other Apple Inc stock posting for more.
Manage your risk.
Have fun!
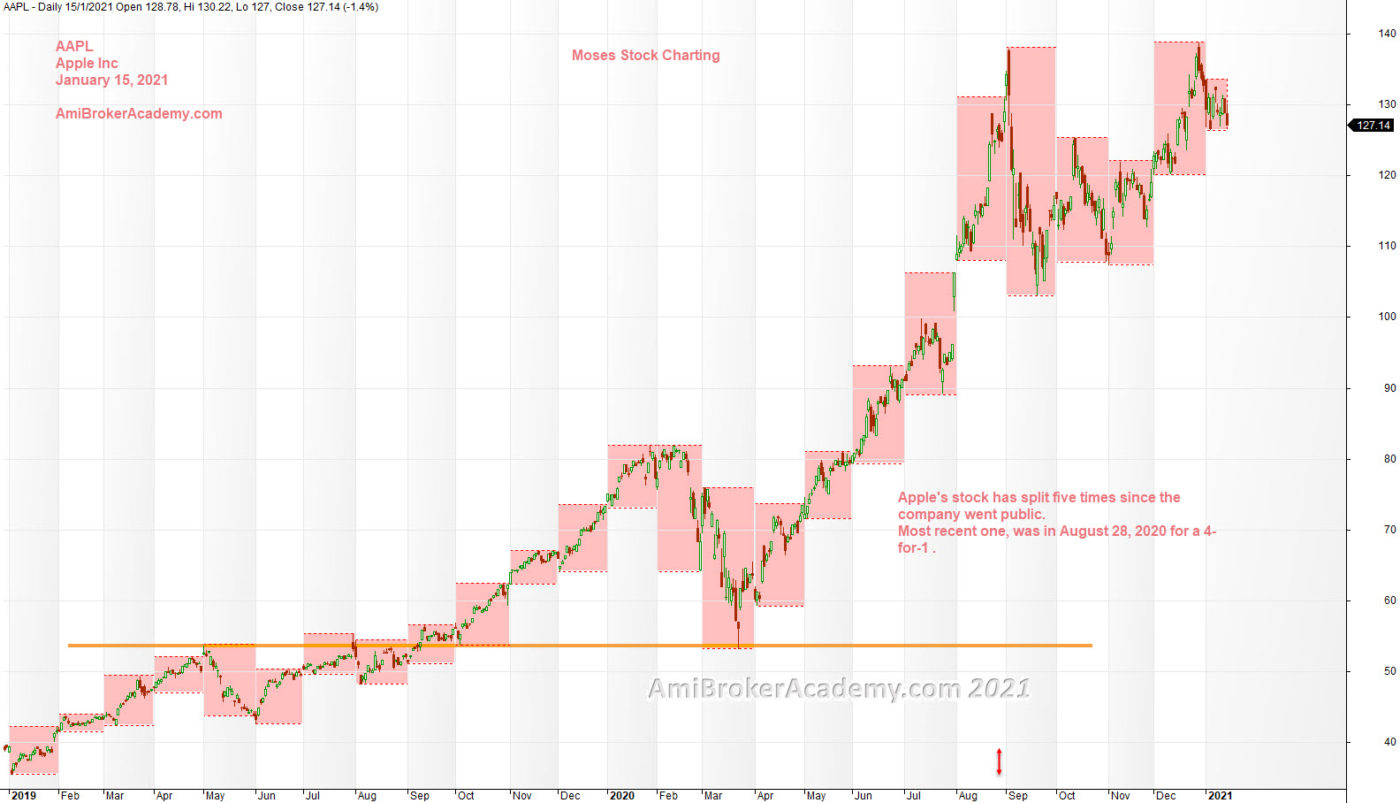
AAPL | Apple Inc and Twenty Four Months Data
Price Action like walking up and down steps.
Have fun!
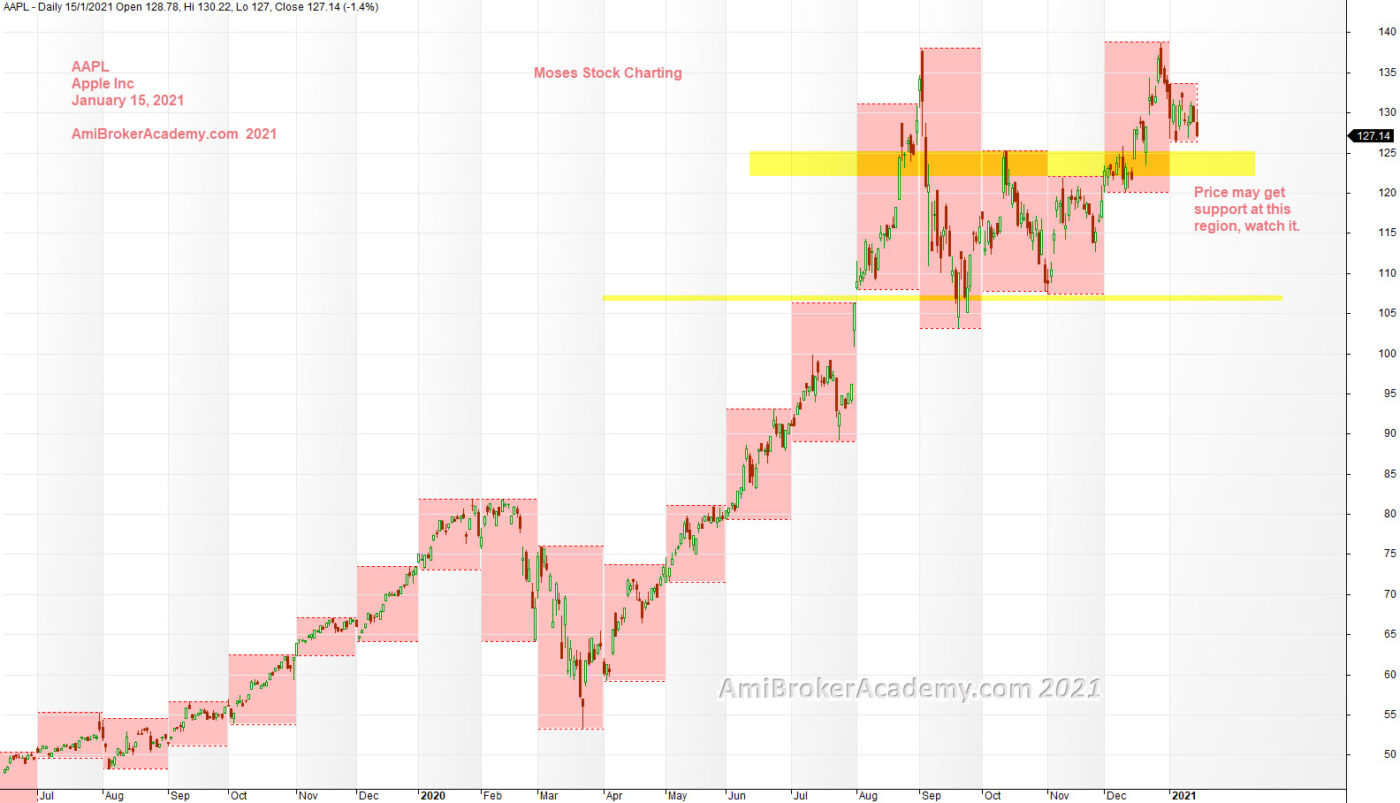
AAPL | apple Inc and eighteen months data
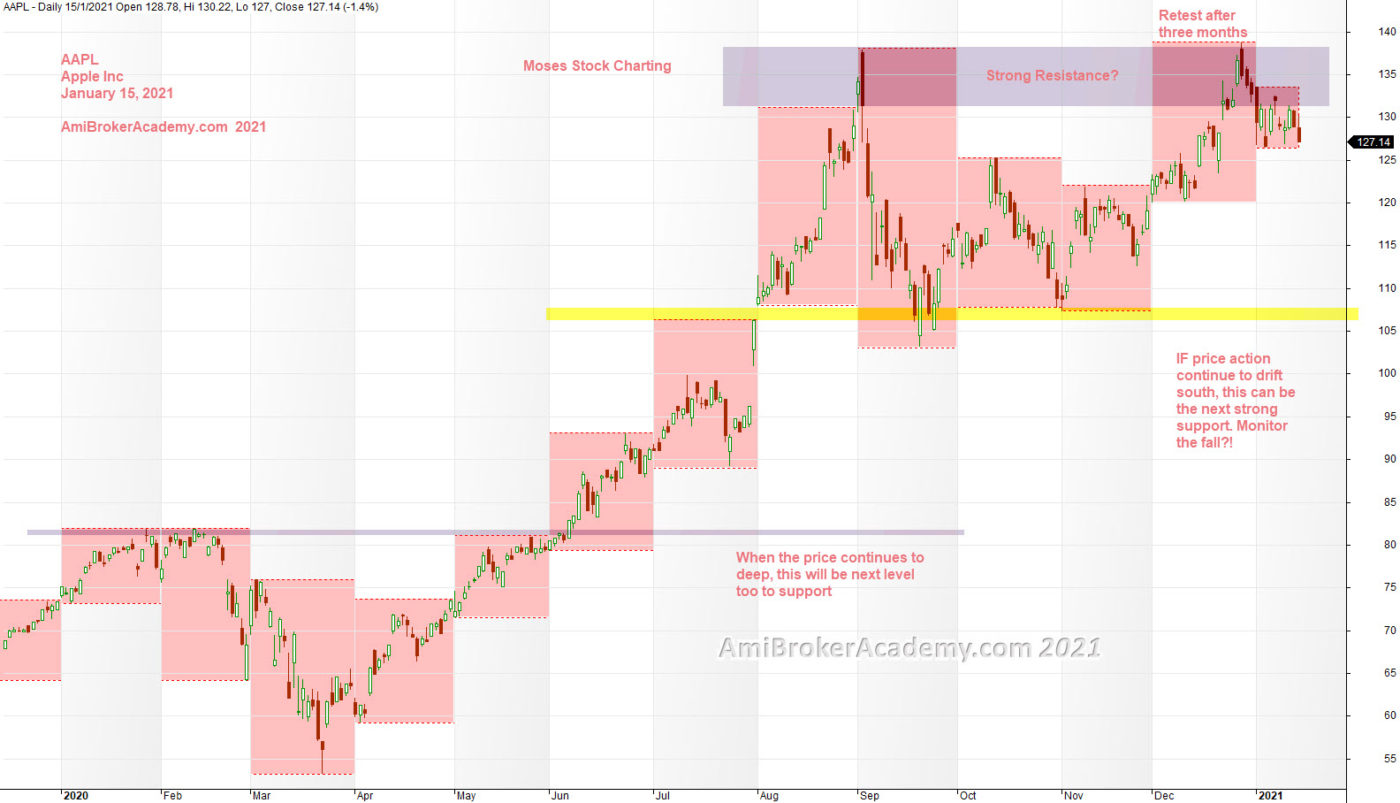
AAPL | Apple Inc and Twelve Months Data
AAPL | Apple Inc and Eight Months Data
Moses Free Stock Charting
Official AmiBrokerAcademy.com Charting
Disclaimer
The above result is for illustration purpose. It is not meant to be used for buy or sell decision. We do not recommend any particular stocks. If particular stocks of such are mentioned, they are meant as demonstration of Amibroker as a powerful charting software and MACD. Amibroker can program to scan the stocks for buy and sell signals.
These are script generated signals. Not all scan results are shown here. The MACD signal should use with price action. Users must understand what MACD and price action are all about before using them. If necessary you should attend a course to learn more on Technical Analysis (TA) and Moving Average Convergence Divergence, MACD.
Once again, the website does not guarantee any results or investment return based on the information and instruction you have read here. It should be used as learning aids only and if you decide to trade real money, all trading decision should be your own.
We learn from many past and present great traders. Kudo to these master.