13 September 2020
Welcome to AmiBroker Academy, Moses Stock Charting. Thanks for visiting the site.
We use powerful AmiBroker charting software tool for our chart and stock scan.
We use indicator, but we read chart on their price action. Don’t miss taken.
We said, we read chart and highlight what we see. We do not choose only winning stock. There is no good and no bad stock, only stock might move soon or not. This posting, we are looking back to a stock has stop trading since last October,
The company filed a plan of liquidation and dissolution in Delaware on Friday, October 4 2019 and the Nasdaq Stock Market stopped trading.
Trade with eyes open. Manage your risk. Have fun!
AABA | Altaba Inc Stock Charting
Study Altaba Inc Stock Charting and Price Action.
Picture worth a thousand words. See chart.
Price Action goes from low in 2016 to high in 2018.
Price Action
Price Action moves in zigzag manner.
Support Resistance or Trendline
Buy Support Sell Resistance.
Boxes
Box is a great visual tool too. We use box to confine the price action high and low for month, quarter or year.
The size of the box indicates the emotion of the market. The bigger the box, the bigger the volatility.
Trade with eyes open.
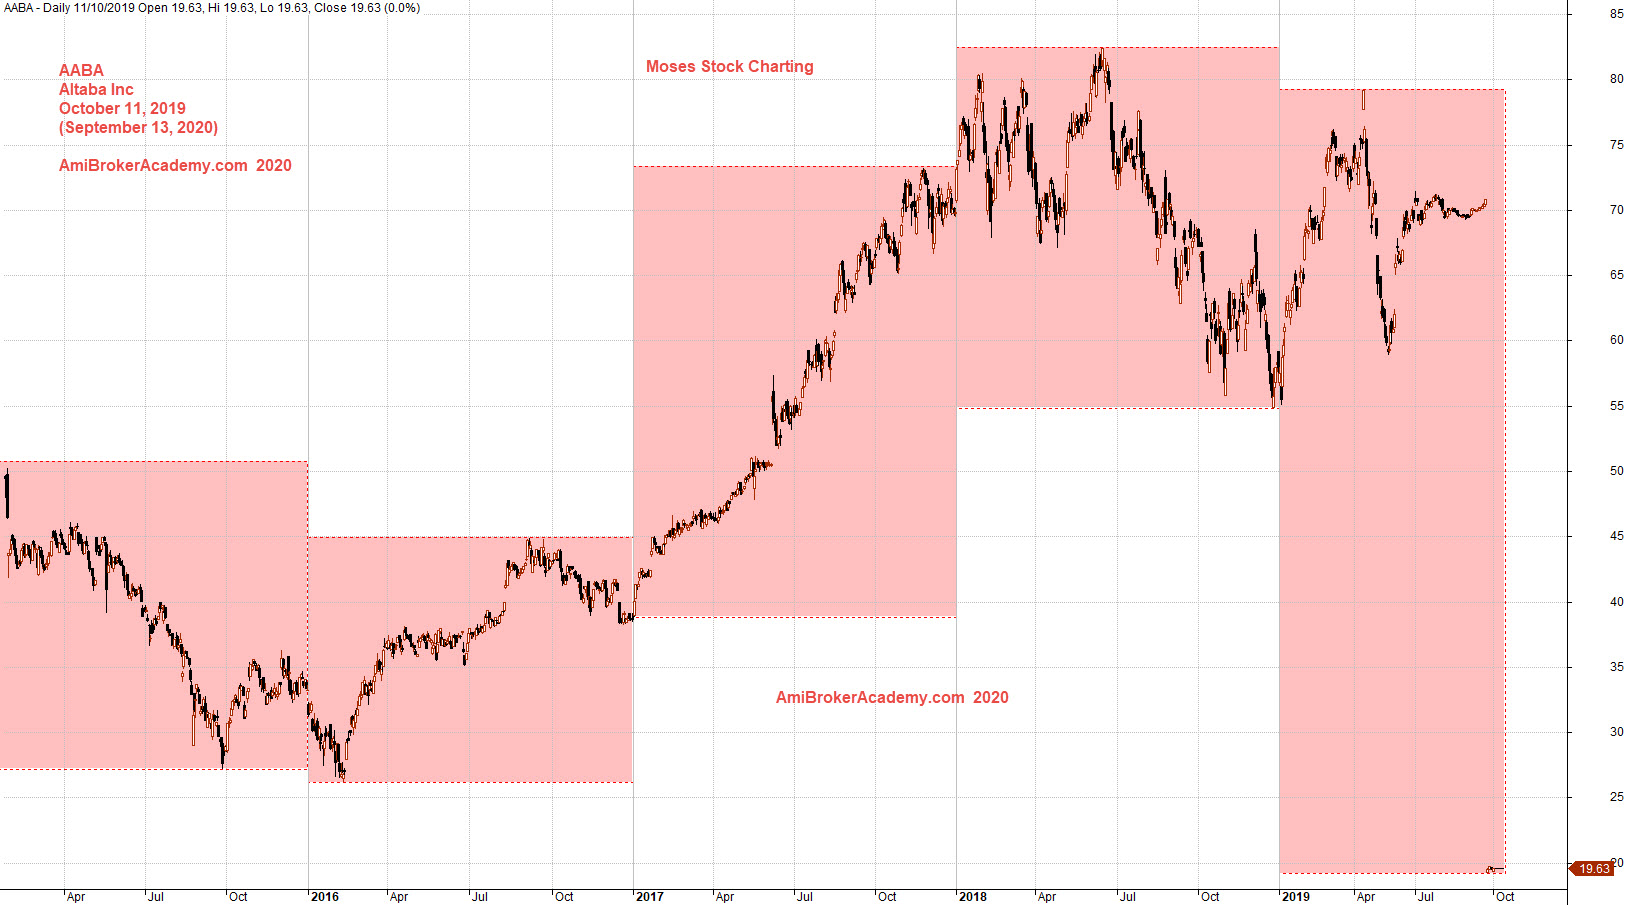
October 2019, Altaba Inc (aka Yahoo) and boxes
Moses Stock Observation
摩西股票观察
AmiBrokerAcademy.com
Disclaimer
The above result is for illustration purpose. It is not meant to be used for buy or sell decision. We do not recommend any particular stocks. If particular stocks of such are mentioned, they are meant as demonstration of Amibroker as a powerful charting software and MACD. Amibroker can program to scan the stocks for buy and sell signals.
These are script generated signals. Not all scan results are shown here. The MACD signal should use with price action. Users must understand what MACD and price action are all about before using them. If necessary you should attend a course to learn more on Technical Analysis (TA) and Moving Average Convergence Divergence, MACD.
Once again, the website does not guarantee any results or investment return based on the information and instruction you have read here. It should be used as learning aids only and if you decide to trade real money, all trading decision should be your own.