November 24, 2017
A34 Amara Holdings and Wave Count
We look back Amara stock price way back to 2013, reference to our wave count, we see a bearish five waves down and follow another possible five waves up. 60 cents seem to be the best high after 2013.
The low is almost below 36 cents.
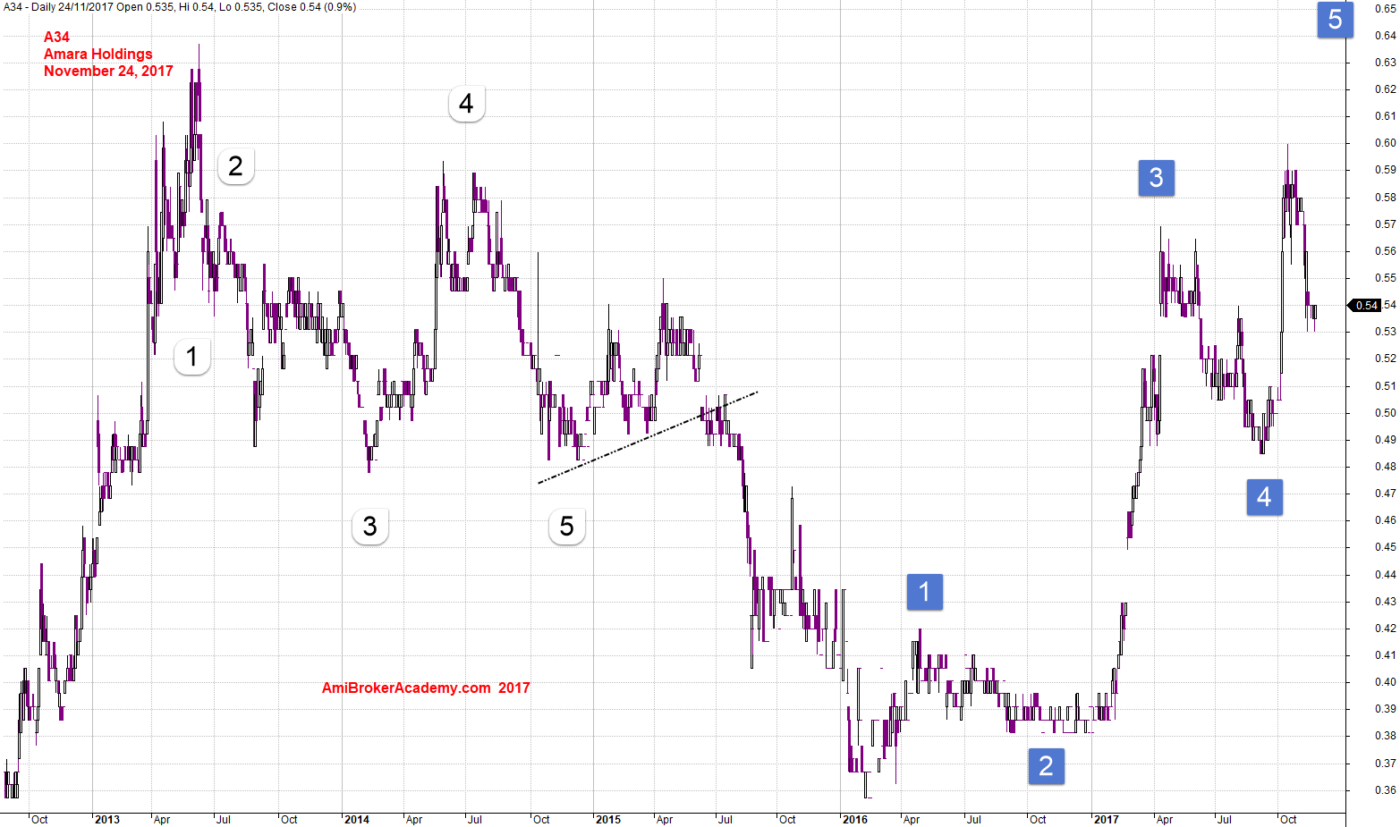
November 24, 2017 Amara Holdings and Wave Count
Amara Holdings and MACD Signals
Study the chart using MACD indicator, we see MACD signals such as MACD Cross Down, MACD Cross Down Zeroline Signals. Is the stock price in the reversal trend, or change in tr
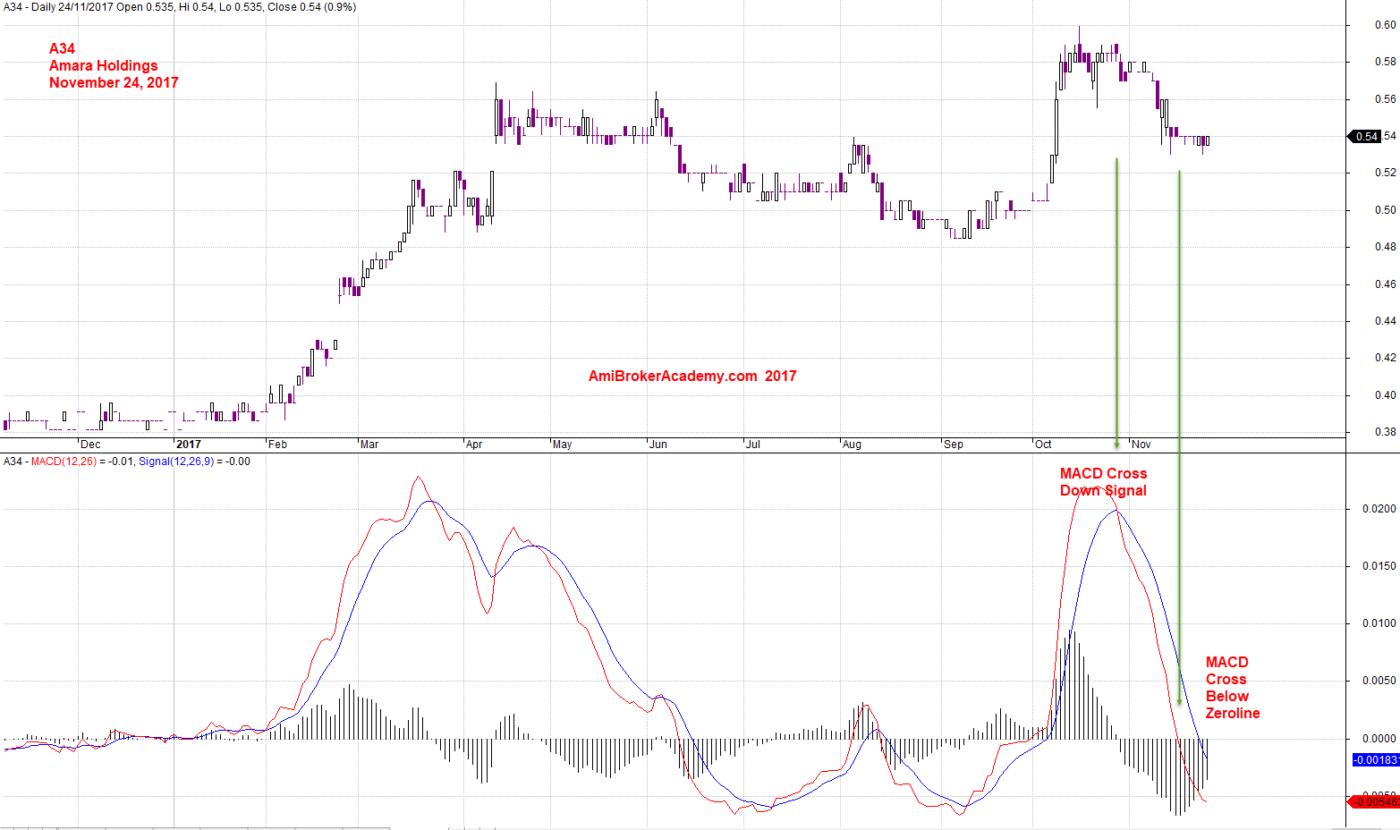
November 24, 2017 Amara Holdings and MACD Signals
Moses
AmiBrokerAcademy.com
Disclaimer
The above result is for illustration purpose. It is not meant to be used for buy or sell decision. We do not recommend any particular stocks. If particular stocks of such are mentioned, they are meant as demonstration of Amibroker as a powerful charting software and MACD. Amibroker can program to scan the stocks for buy and sell signals.
These are script generated signals. Not all scan results are shown here. The MACD signal should use with price action. Users must understand what MACD and price action are all about before using them. If necessary you should attend a course to learn more on Technical Analysis (TA) and Moving Average Convergence Divergence, MACD.
Once again, the website does not guarantee any results or investment return based on the information and instruction you have read here. It should be used as learning aids only and if you decide to trade real money, all trading decision should be your own.