October 12, 2018
Think Think Got More Things
Thanks for visiting the site.
Moses Stock Stories
^DJI US Dow Jones Industrial Average Index Charting
Study Dow Jones Industrial Average index, see price action picture worth a thousand words. Stock market has been on a bull trend for the longer time ever. But, October 10 has change the situation. Price action has a drop of 800-point. Now the price action is now lower than August low.
Trade with your eyes open.
With MACD indicator, see chart.
Manage Your Risk!
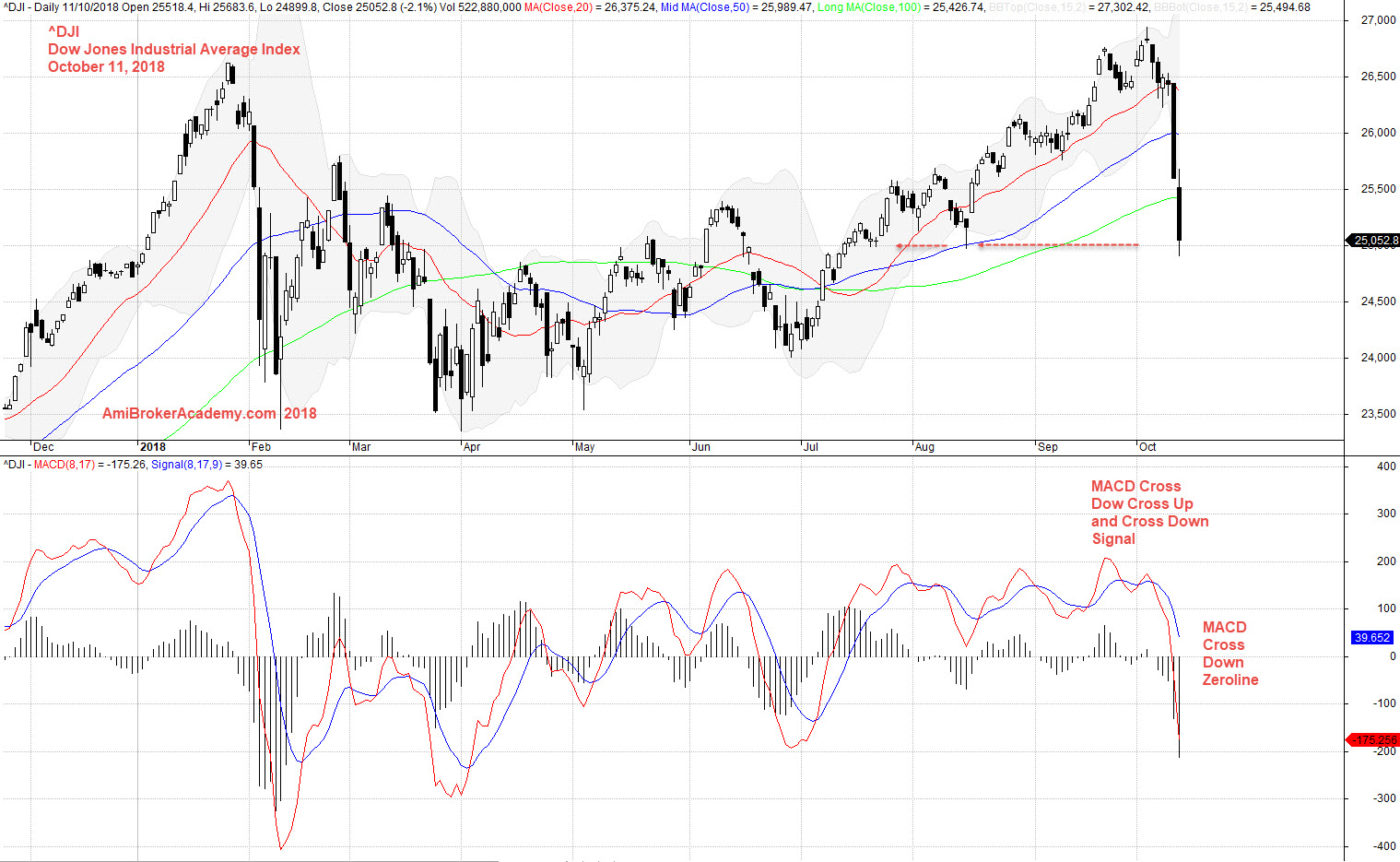
October 11, 2018 Dow Jones Industrial Average Index and MACD
If you can see the whole chart, “press Ctrl and -” to zoom out to see the entire chart.
Moses
AmiBrokerAcademy.com
Disclaimer
The above result is for illustration purpose. It is not meant to be used for buy or sell decision. We do not recommend any particular stocks. If particular stocks of such are mentioned, they are meant as demonstration of Amibroker as a powerful charting software and MACD. Amibroker can program to scan the stocks for buy and sell signals.
These are script generated signals. Not all scan results are shown here. The MACD signal should use with price action. Users must understand what MACD and price action are all about before using them. If necessary you should attend a course to learn more on Technical Analysis (TA) and Moving Average Convergence Divergence, MACD.
Once again, the website does not guarantee any results or investment return based on the information and instruction you have read here. It should be used as learning aids only and if you decide to trade real money, all trading decision should be your own.