May 18, 2019
Welcome to AmiBrokerAcademy.com. Thanks for visiting the site.
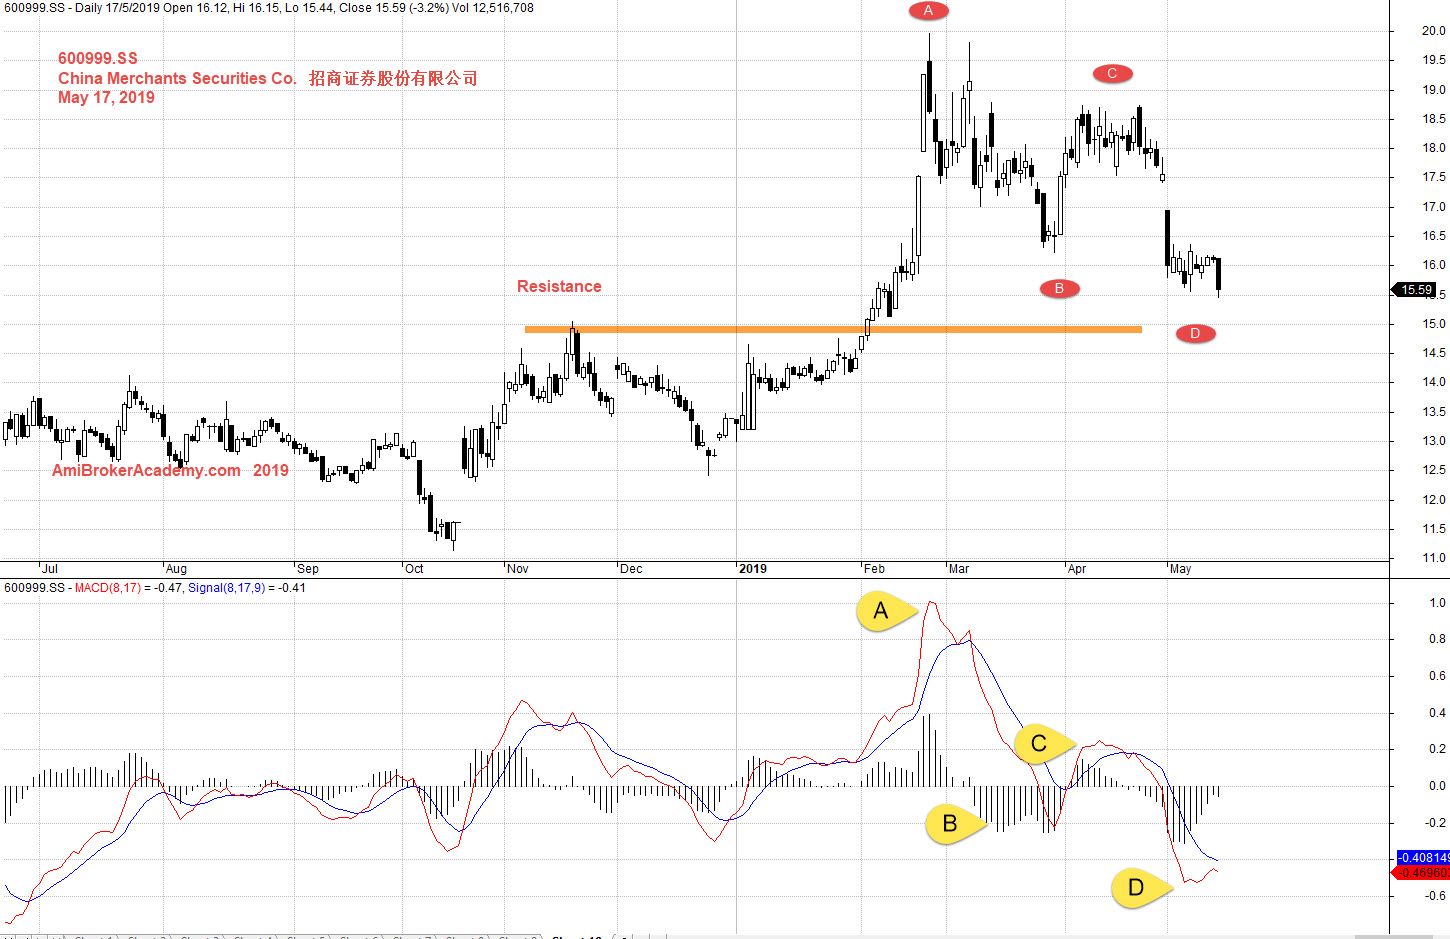
600999.SS China Merchants Securities Co. 招商证券股份有限公司 Stock Charting
Study China Merchants Securities Co. 招商证券股份有限公司 Stock chart and MACD.
See chart, picture worth a thousand words.
Price action from low pullback to test the high at 20 RMB, and follow the ABCD bear trend and cross below 100 MA. At May, 20 MA begin to cross low below 50 MA. Although both 20 MA and 50 MA are still above 100 MA. The price action already completed an AB=CD pattern.
Price action is falling and may test the previous resistance.
See MACD is also has a similar ABCD pattern.
Trade with your eyes open.
Moses Stock Observation
AmiBrokerAcademy.com
Disclaimer
The above result is for illustration purpose. It is not meant to be used for buy or sell decision. We do not recommend any particular stocks. If particular stocks of such are mentioned, they are meant as demonstration of Amibroker as a powerful charting software and MACD. Amibroker can program to scan the stocks for buy and sell signals.
These are script generated signals. Not all scan results are shown here. The MACD signal should use with price action. Users must understand what MACD and price action are all about before using them. If necessary you should attend a course to learn more on Technical Analysis (TA) and Moving Average Convergence Divergence, MACD.
Once again, the website does not guarantee any results or investment return based on the information and instruction you have read here. It should be used as learning aids only and if you decide to trade real money, all trading decision should be your own.