4 September 2020
Welcome to AmiBroker Academy, Moses Stock Charting. Thanks for visiting the site.
We use powerful AmiBroker charting software tool for our chart and stock scan.
We do not just select good (winning) stock. We are here to analyse any chart that pop up at your sight that we want to understand the market expectation. To us, there are not good or bad stocks.
But only stocks that have possible movement or not.
You must understand buying bull trend does not mean you will make money. It is all deepening on when you buy and when you are taking profit. Be careful (don’t mislead by many of the master out there).
You must acquire the skill to look left and think right. Learn to understand past price action on the chart try to tell you, the message from the candlestick or from the indicators. Have fun!
We share with you what we see on the chart. We can have different interpretation. There is no right no wrong in life, or market. Our remarks on chart are what the price action show us. Reading price action is like reading an English or a Mandarin language story. Have fun!
600688 Yonyou Network Technology 用友网络科技 Stock Charting
Study Yonyou Network Technology 用友网络科技 Stock Charting and Price Action.
We use indicator, but we read chart on their price action. Don’t miss taken.
Picture worth a thousand words. See chart.
Trade with eyes open. Mange your risk.
Price Action
Price Action moves in zigzag manner.
Support Resistance or Trendline
Buy Support Sell Resistance.
Wave
Wave makes up of three moving averages. It uses high, low and close of 34 EMA.
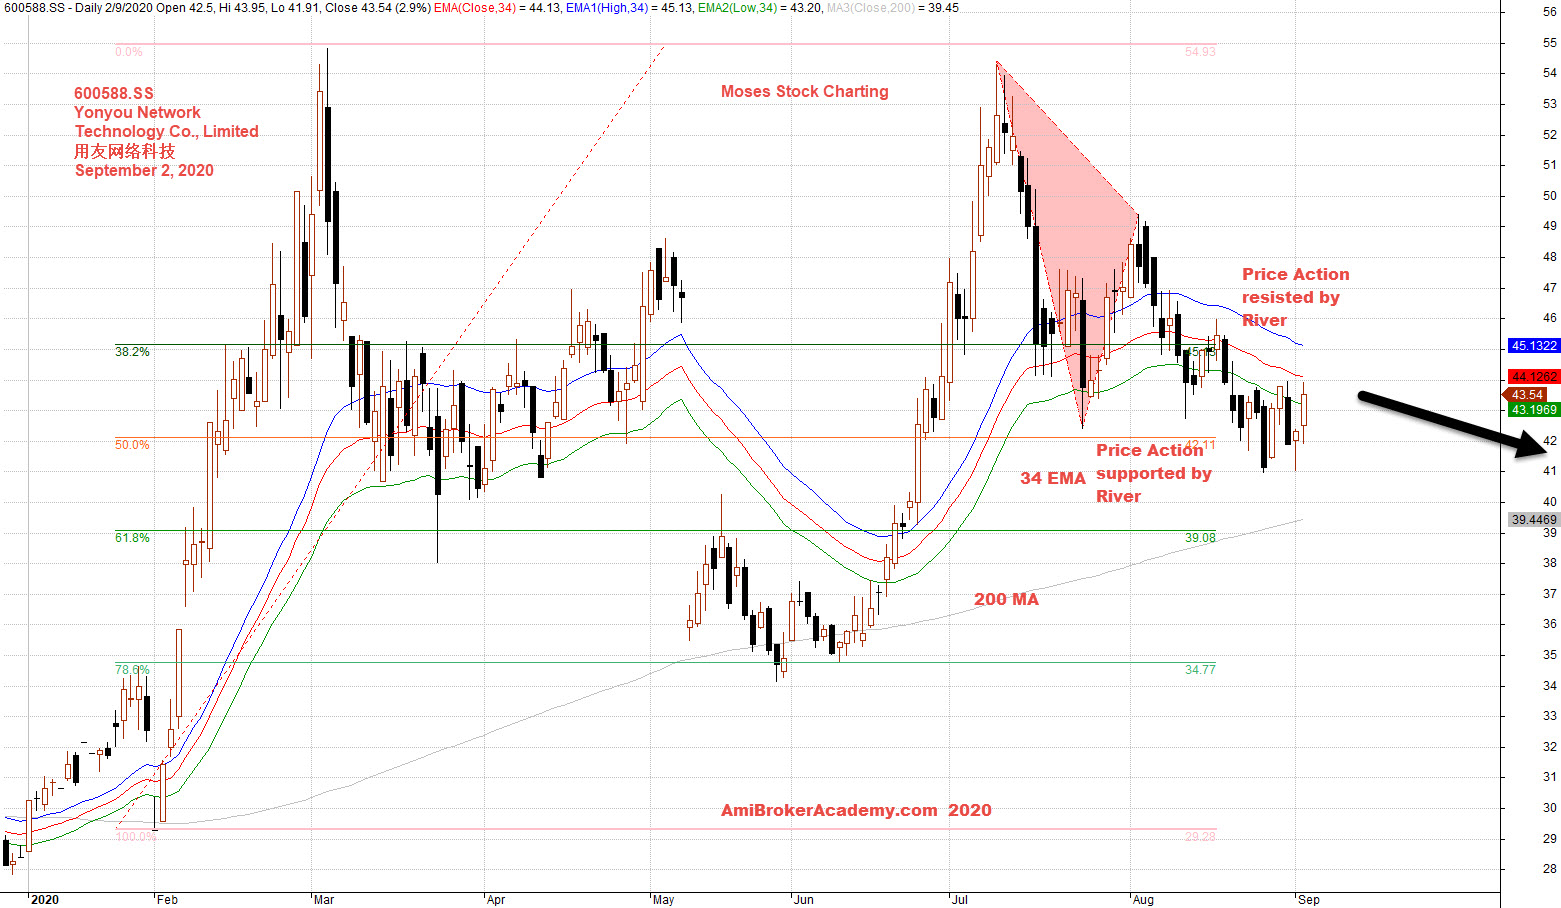
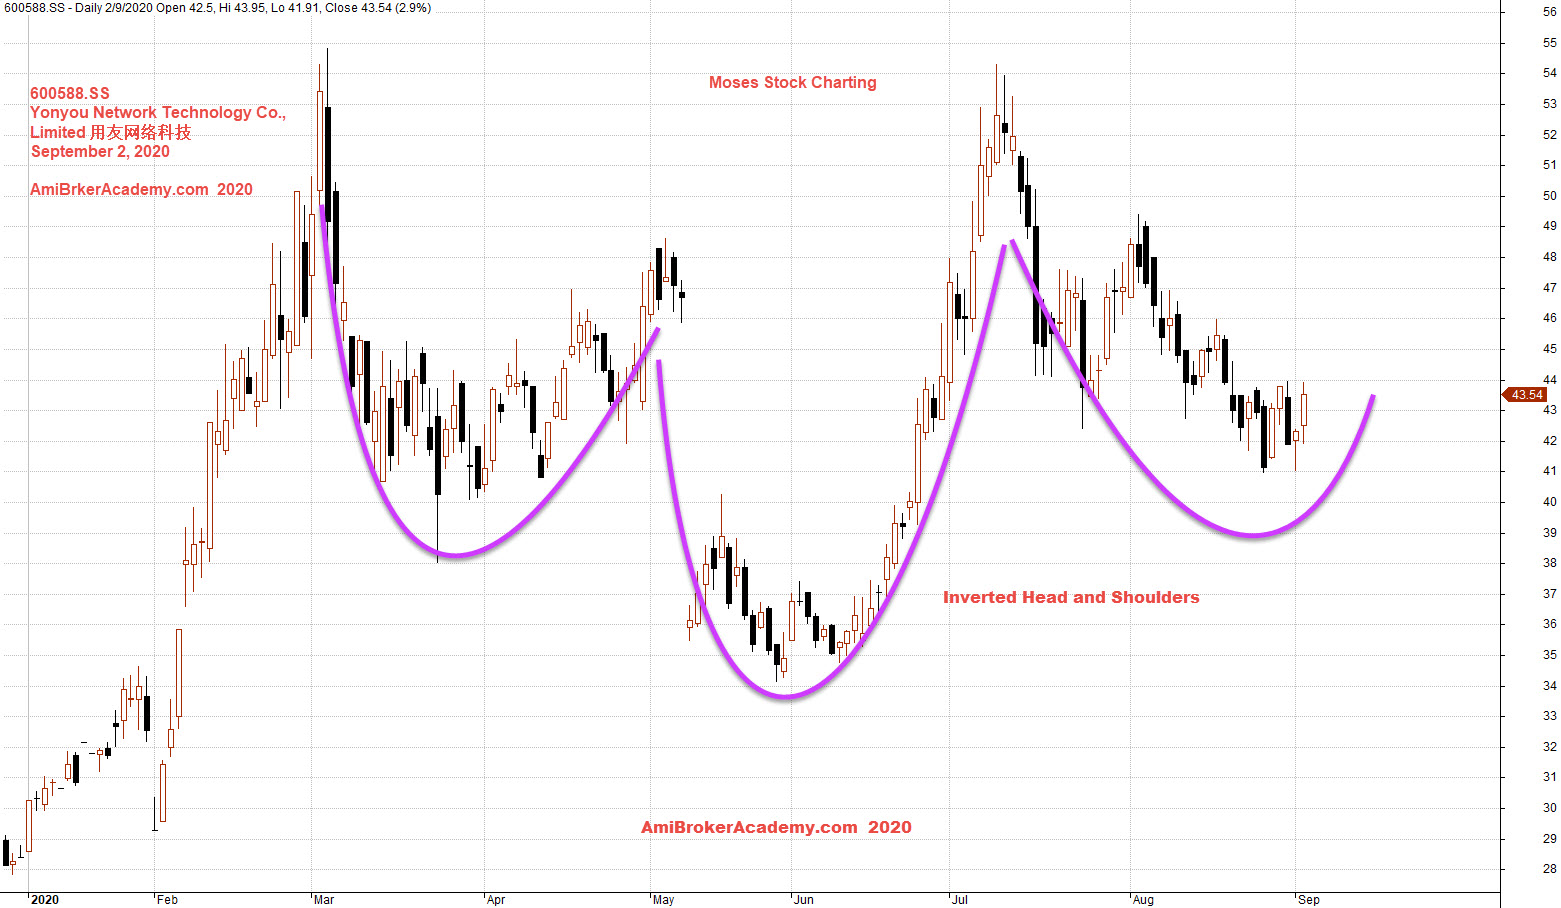
Chart Pattern
We see an inverted head and shoulders.
Trade with eyes open.
Moses Stock Observation
AmiBrokerAcademy.com
Disclaimer
The above result is for illustration purpose. It is not meant to be used for buy or sell decision. We do not recommend any particular stocks. If particular stocks of such are mentioned, they are meant as demonstration of Amibroker as a powerful charting software and MACD. Amibroker can program to scan the stocks for buy and sell signals.
These are script generated signals. Not all scan results are shown here. The MACD signal should use with price action. Users must understand what MACD and price action are all about before using them. If necessary you should attend a course to learn more on Technical Analysis (TA) and Moving Average Convergence Divergence, MACD.
Once again, the website does not guarantee any results or investment return based on the information and instruction you have read here. It should be used as learning aids only and if you decide to trade real money, all trading decision should be your own.