March 17, 2018
Shanghai Stock Chart Analysis
600385.SS Shandong Jintai Group Co 山东金泰 Support Resistance
Study chart, checking the support resistance using month high low.
Manage your risk!
Powerful Chart Software – AmiBroker
The following chart is produced using AmiBroker charting software. It is a powerful chart software. Anything, finance ticket you could download from Yahoo! Finance you could plot them, those you are interested all in a chart, so you could analyse them.
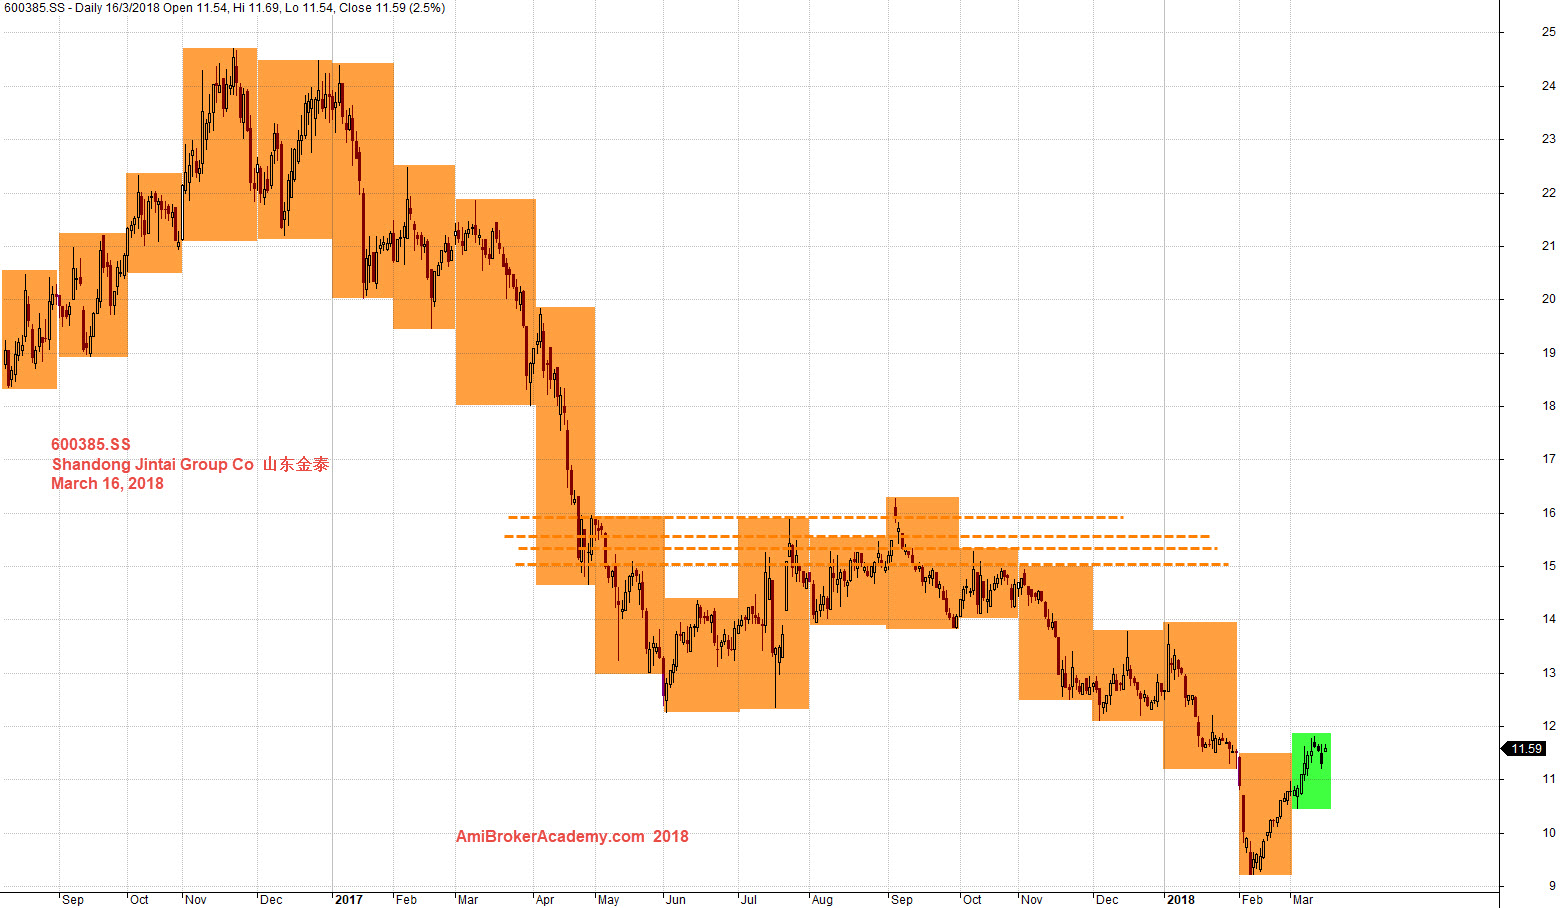
March 16, 2018 Shandong Jintai Group Co 山东金泰 and Support Resistance
Shandong Jintai Group Co 山东金泰 Data From 2010
Study chart from 2010, stock price ever reach 36, but fail to hold high and now the 10. See chart for more.
Manage your risk!
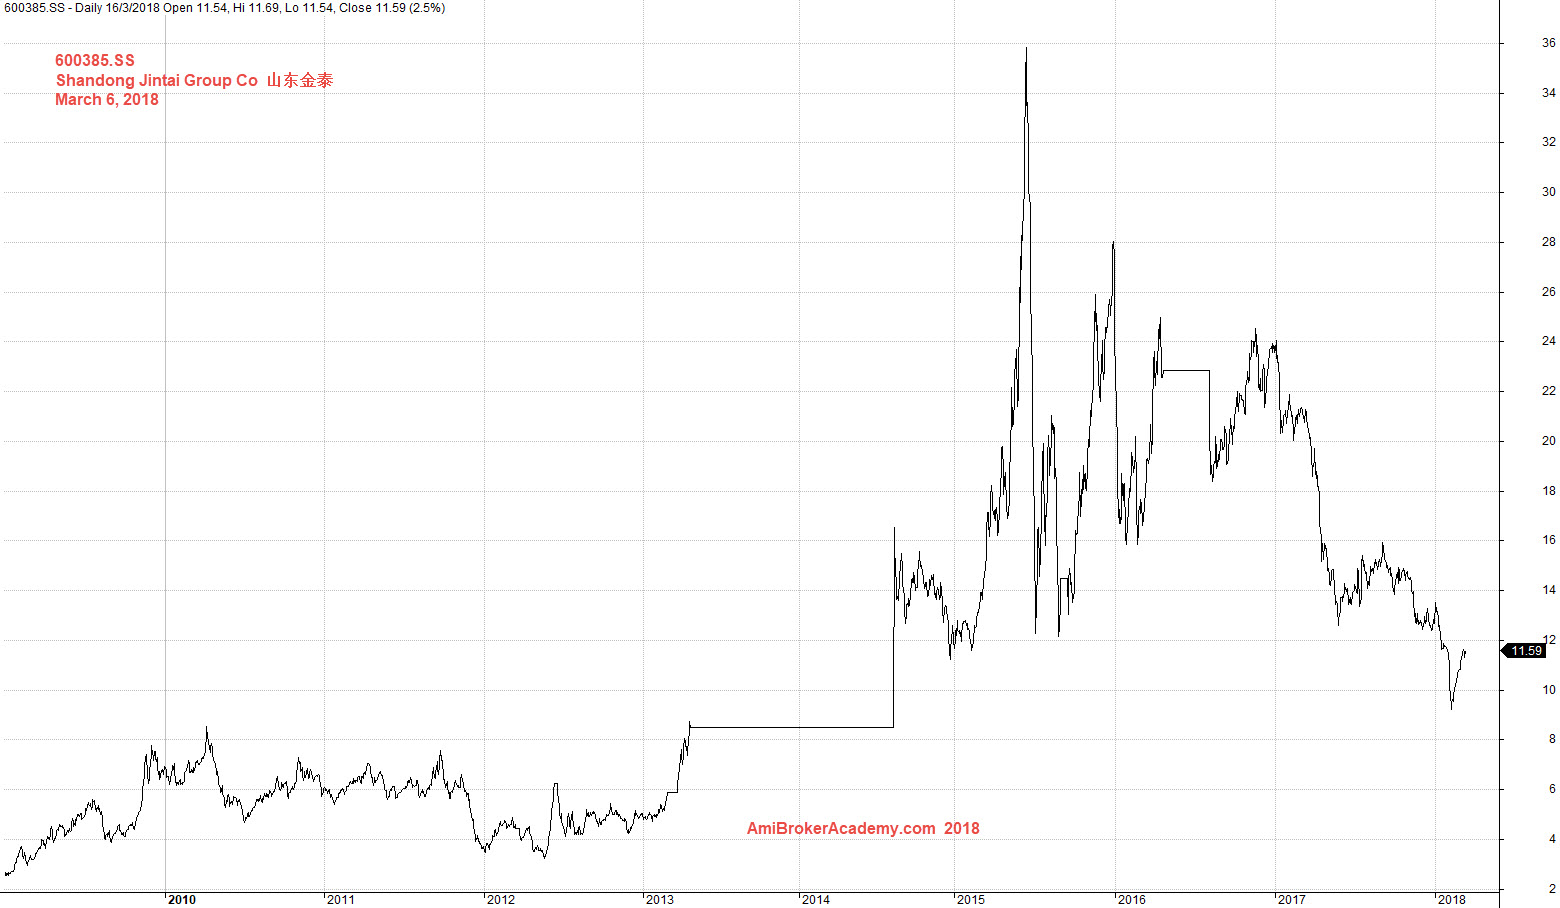
20180316 Shandong Jintai Group Co 山东金泰 Data From 2010
Moses China Stock Chart Analysis
AmiBrokerAcademy.com
Disclaimer
The above result is for illustration purpose. It is not meant to be used for buy or sell decision. We do not recommend any particular stocks. If particular stocks of such are mentioned, they are meant as demonstration of Amibroker as a powerful charting software and MACD. Amibroker can program to scan the stocks for buy and sell signals.
These are script generated signals. Not all scan results are shown here. The MACD signal should use with price action. Users must understand what MACD and price action are all about before using them. If necessary you should attend a course to learn more on Technical Analysis (TA) and Moving Average Convergence Divergence, MACD.
Once again, the website does not guarantee any results or investment return based on the information and instruction you have read here. It should be used as learning aids only and if you decide to trade real money, all trading decision should be your own.