November 8, 2018
Thanks for visiting the site.
Sometime back in June, we study Nanjing Iron & Steel Company stock chart.. Let relook at the stock chart again.
Shanghai Stock Analysis
600282.SS 南钢股份 Nanjing Iron & Steel Co Stock Charting
See chart, the price action of 南钢股份 Nanjing Iron & Steel Co stock. The stock price test 6.6 RMB then follow H M Gartley 222 pattern to bring the price action to low at 4.4 RMB. Another ABCD pattern to send the price action up again test 5.6 and next 6. Finally the price action test 3.6 RMB low. Picture worth a thousand words, see chart. Trade with eyes open, manage your risk.
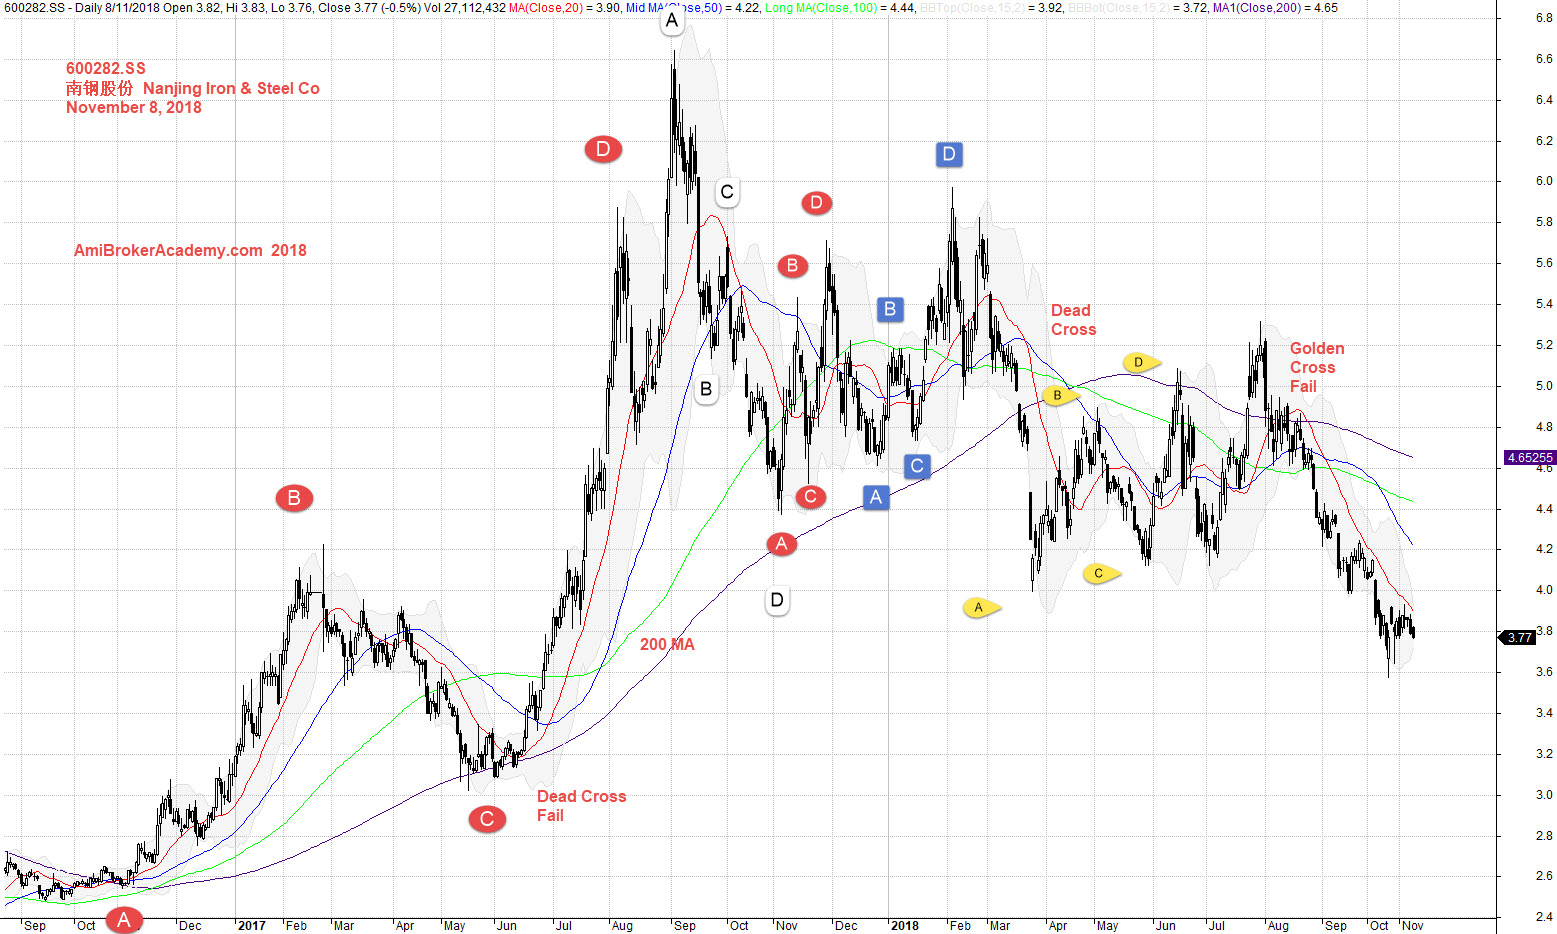
November 8, 2018 南钢股份 Nanjing Iron & Steel Co and Moving Averages
Add MACD indicator, see chart. Picture worth a thousand words.
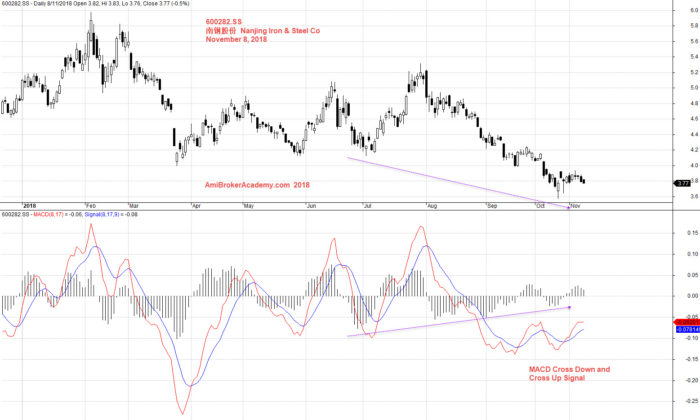
November 8, 2018 南钢股份 Nanjing Iron & Steel Co and MACD
Moses
AmiBrokerAcademy.com
Disclaimer
The above result is for illustration purpose. It is not meant to be used for buy or sell decision. We do not recommend any particular stocks. If particular stocks of such are mentioned, they are meant as demonstration of Amibroker as a powerful charting software and MACD. Amibroker can program to scan the stocks for buy and sell signals.
These are script generated signals. Not all scan results are shown here. The MACD signal should use with price action. Users must understand what MACD and price action are all about before using them. If necessary you should attend a course to learn more on Technical Analysis (TA) and Moving Average Convergence Divergence, MACD.
Once again, the website does not guarantee any results or investment return based on the information and instruction you have read here. It should be used as learning aids only and if you decide to trade real money, all trading decision should be your own.