March 9, 2018
China Stock Analysis
600072.SS CSSC Science & Technology Co 中船科技 Charting
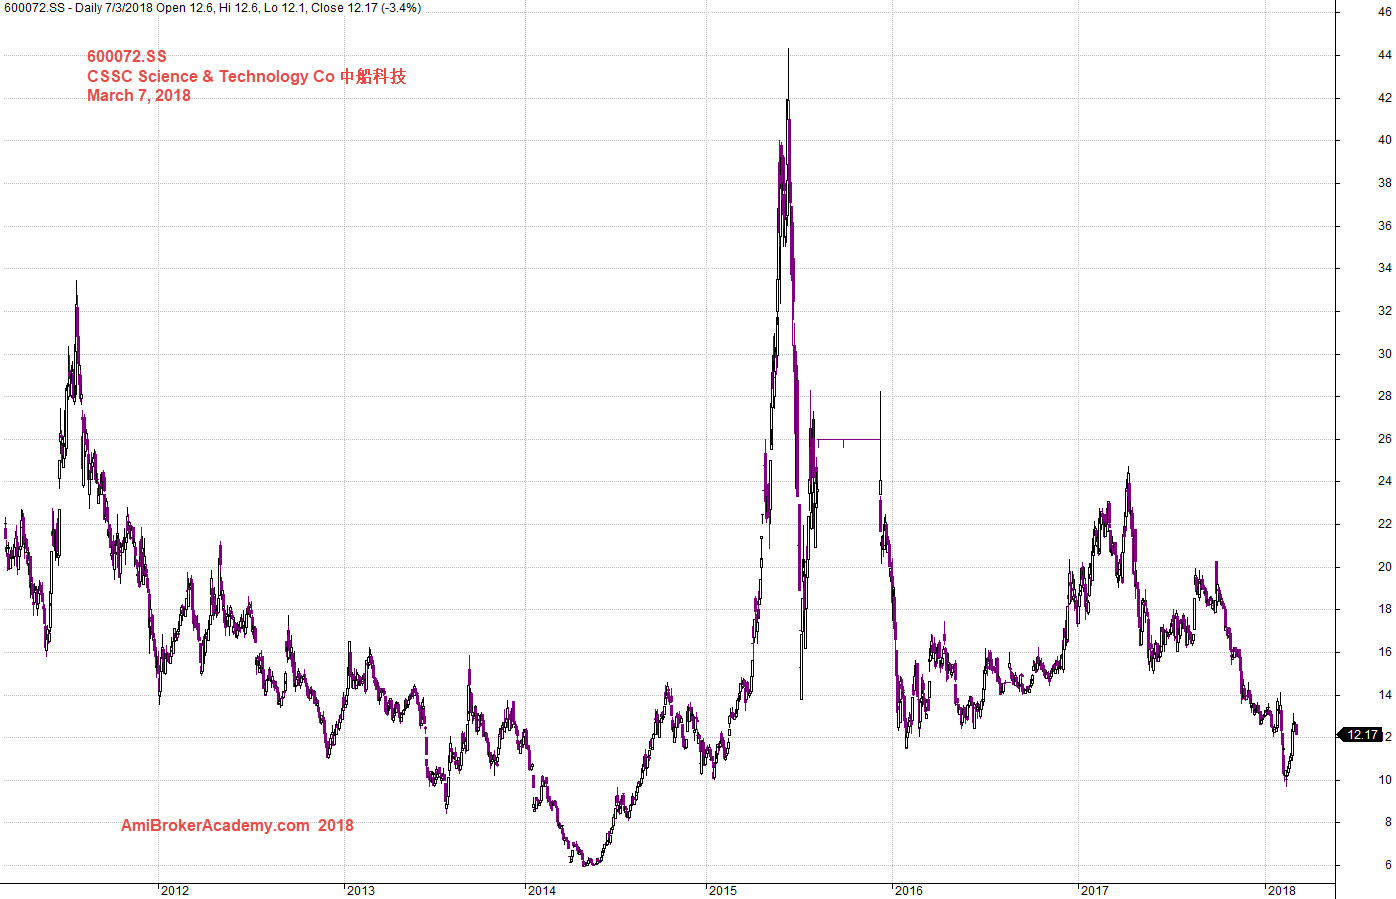
Study China Shanghai Stock CSSC Science & Technology Co 中船科技, the price action keeps continue to forming lower low from mid 2017.
Manage your risk.
March 7, 2018 CSSC Science & Technology Co 中船科技 Charting
Powerful Chart Software – AmiBroker
The following chart is produced using AmiBroker charting software. It is a powerful chart software. You plot the stocks you are interested all in one chart, as long as you still could read them. See chart below.
CSSC Science & Technology Co 中船科技 and Fibo Extension
See chart for more.
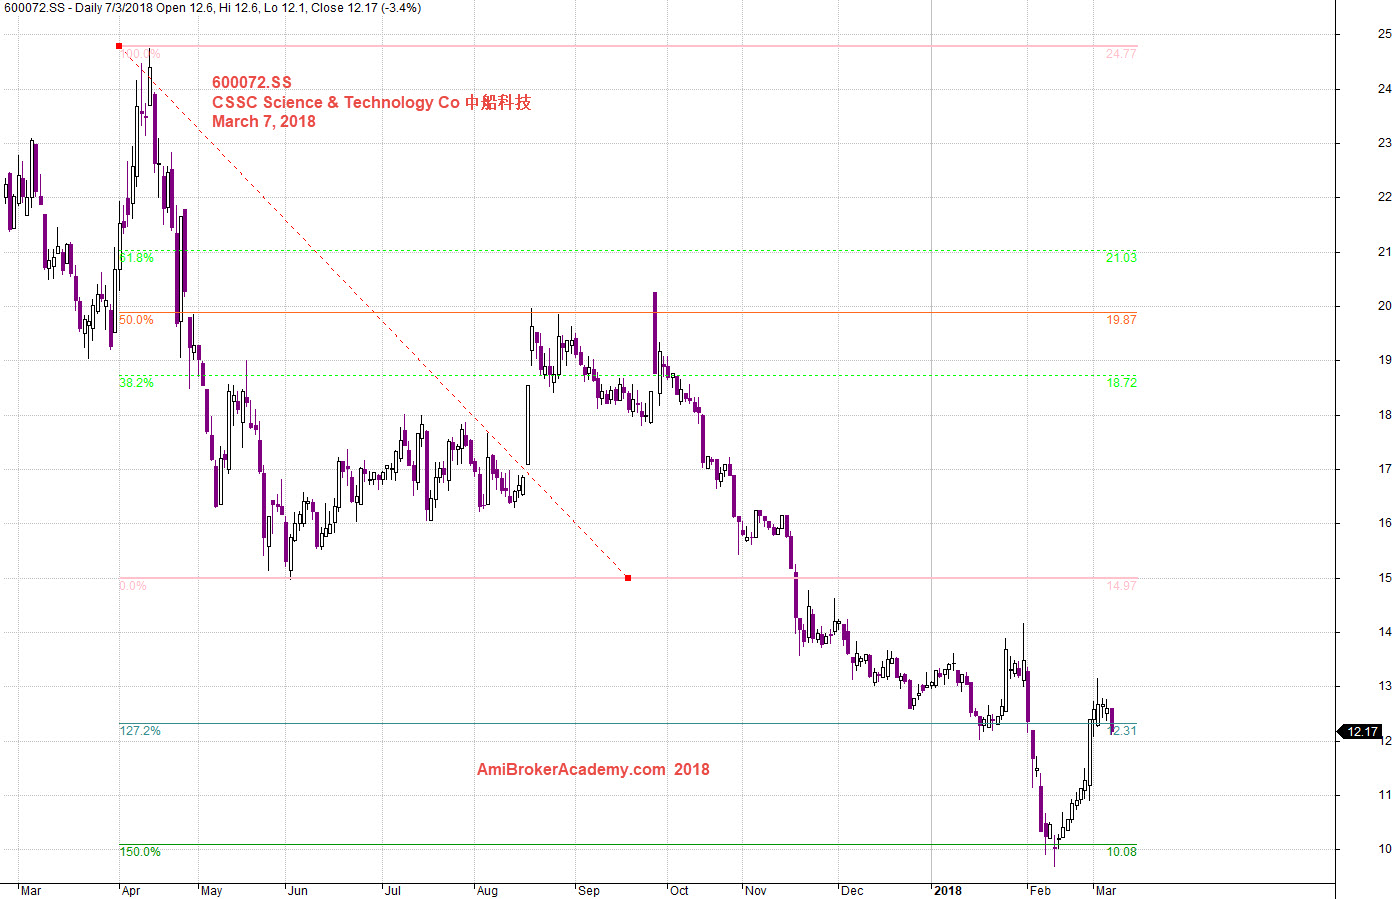
20180307 CSSC Science & Technology Co 中船科技 and Fibo Extension
CSSC Science & Technology Co 中船科技 and MACD
See chart for more.
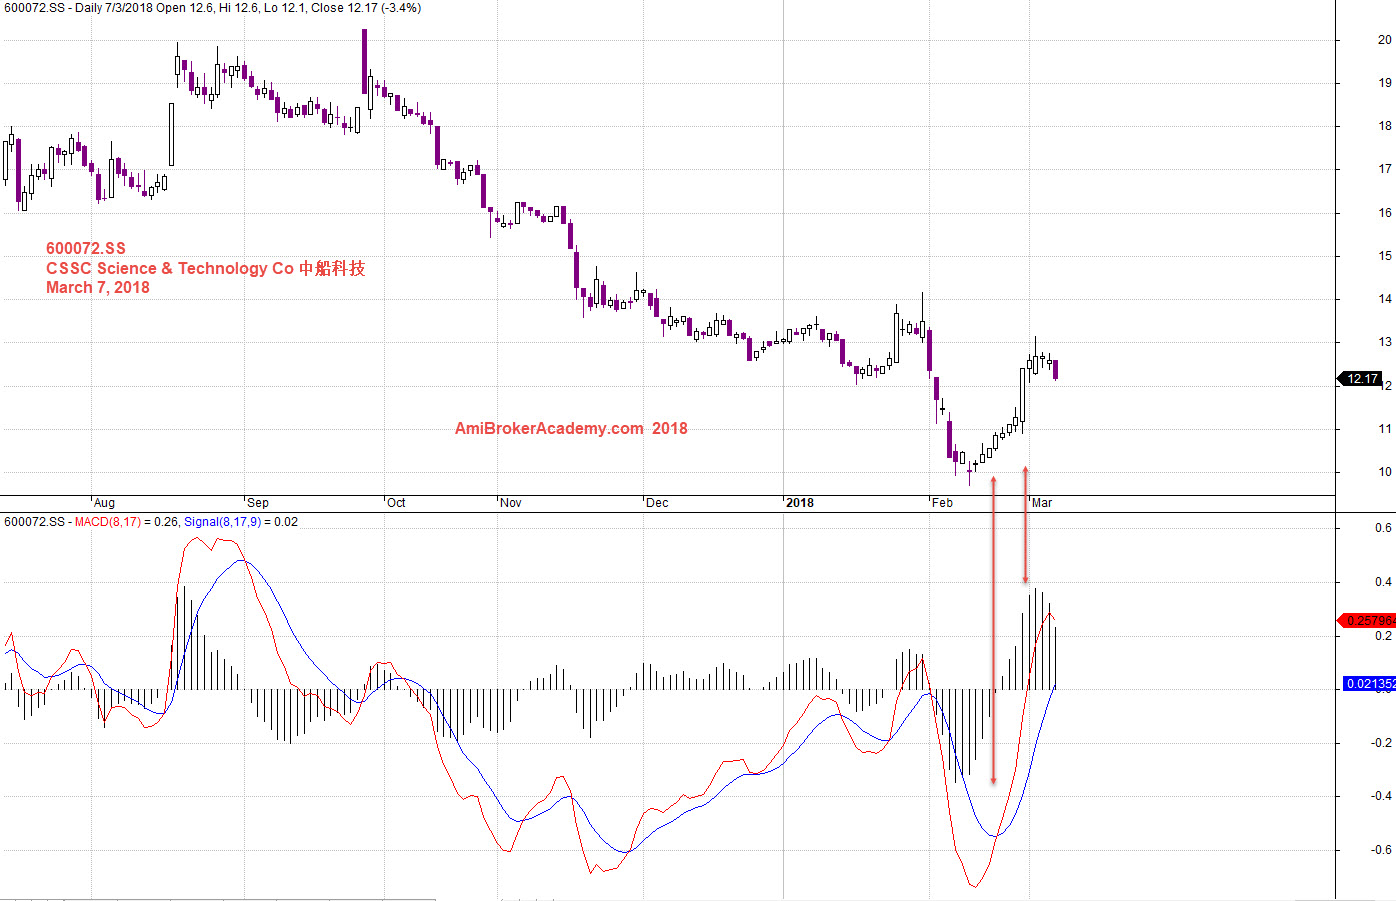
20180307 CSSC Science & Technology Co 中船科技 and MACD
Moses
AmiBrokerAcademy.com
Disclaimer
The above result is for illustration purpose. It is not meant to be used for buy or sell decision. We do not recommend any particular stocks. If particular stocks of such are mentioned, they are meant as demonstration of Amibroker as a powerful charting software and MACD. Amibroker can program to scan the stocks for buy and sell signals.
These are script generated signals. Not all scan results are shown here. The MACD signal should use with price action. Users must understand what MACD and price action are all about before using them. If necessary you should attend a course to learn more on Technical Analysis (TA) and Moving Average Convergence Divergence, MACD.
Once again, the website does not guarantee any results or investment return based on the information and instruction you have read here. It should be used as learning aids only and if you decide to trade real money, all trading decision should be your own.