19 February, 2019
Thanks for visiting the site.
Today, the second day of Chinese Lunar New Year. Chinese celebrate 15 (fifteen) days of Chinese New Year.
Just like the west, they celebrate 12 days of Christmas.
Free U.S. Stock Five-day MACD Scan
Wht is AmiBroker AFL?
See the following link https://www.amibroker.com/guide/AFL.html on AmiBroker AFL.
What is MACD?
MACD stands for Moving Average Convergence Divergence, common setting is (12,26,9)
MACD indicator is a trend trading system that makes up of 2 lines. The MACD Line (fast line) and MACD Signal Line (slow line).
1) When the MACD Line crosses over the MACD Signal Line the trend is bullish. When the MACD Line crosses below the MACD Signal the trend is bearish.
2) When the MACD Line crosses above zero line the trend is bullish. When the MACD line crosses below zero line the trend is bearish.
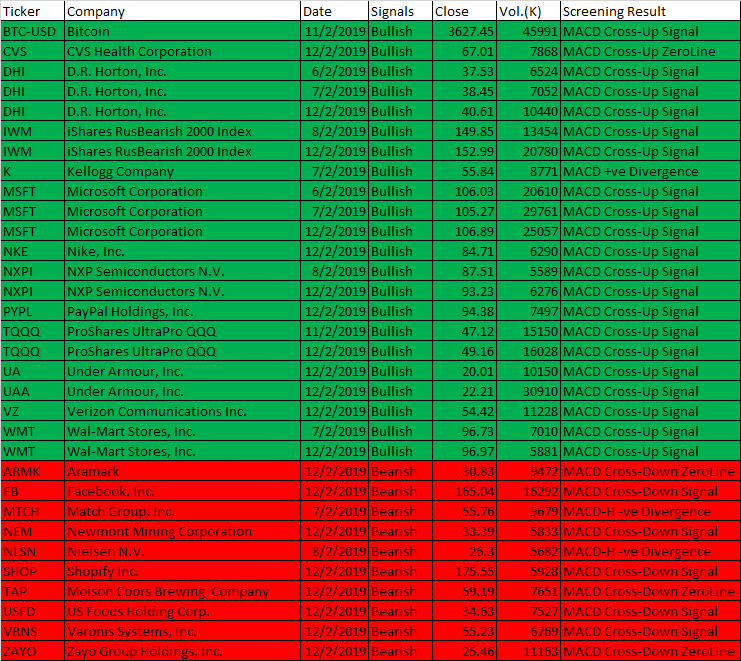
6 to 12 February 2019 AmiBroker AFL Script Generated Five-day U.S. Stock MACD Signals
The following are script generated Five-day U.S. Stock Market MACD signals using the Powerful AmiBroker’s AFL.
The MACD Setting used is (8,17,9)
| Ticker | Company | Date | Signals | Close | Vol.(K) | Screening Result |
| BTC-USD | Bitcoin | 11/2/2019 | Bullish | 3627.45 | 45991 | MACD Cross-Up Signal |
| CVS | CVS Health Corporation | 12/2/2019 | Bullish | 67.01 | 7868 | MACD Cross-Up ZeroLine |
| DHI | D.R. Horton, Inc. | 6/2/2019 | Bullish | 37.53 | 6524 | MACD Cross-Up Signal |
| DHI | D.R. Horton, Inc. | 7/2/2019 | Bullish | 38.45 | 7052 | MACD Cross-Up Signal |
| DHI | D.R. Horton, Inc. | 12/2/2019 | Bullish | 40.61 | 10440 | MACD Cross-Up Signal |
| IWM | iShares RusBearish 2000 Index | 8/2/2019 | Bullish | 149.85 | 13454 | MACD Cross-Up Signal |
| IWM | iShares RusBearish 2000 Index | 12/2/2019 | Bullish | 152.99 | 20780 | MACD Cross-Up Signal |
| K | Kellogg Company | 7/2/2019 | Bullish | 55.84 | 8771 | MACD +ve Divergence |
| MSFT | Microsoft Corporation | 6/2/2019 | Bullish | 106.03 | 20610 | MACD Cross-Up Signal |
| MSFT | Microsoft Corporation | 7/2/2019 | Bullish | 105.27 | 29761 | MACD Cross-Up Signal |
| MSFT | Microsoft Corporation | 12/2/2019 | Bullish | 106.89 | 25057 | MACD Cross-Up Signal |
| NKE | Nike, Inc. | 12/2/2019 | Bullish | 84.71 | 6290 | MACD Cross-Up Signal |
| NXPI | NXP Semiconductors N.V. | 8/2/2019 | Bullish | 87.51 | 5589 | MACD Cross-Up Signal |
| NXPI | NXP Semiconductors N.V. | 12/2/2019 | Bullish | 93.23 | 6276 | MACD Cross-Up Signal |
| PYPL | PayPal Holdings, Inc. | 12/2/2019 | Bullish | 94.38 | 7497 | MACD Cross-Up Signal |
| TQQQ | ProShares UltraPro QQQ | 11/2/2019 | Bullish | 47.12 | 15150 | MACD Cross-Up Signal |
| TQQQ | ProShares UltraPro QQQ | 12/2/2019 | Bullish | 49.16 | 16028 | MACD Cross-Up Signal |
| UA | Under Armour, Inc. | 12/2/2019 | Bullish | 20.01 | 10150 | MACD Cross-Up Signal |
| UAA | Under Armour, Inc. | 12/2/2019 | Bullish | 22.21 | 30910 | MACD Cross-Up Signal |
| VZ | Verizon Communications Inc. | 12/2/2019 | Bullish | 54.42 | 11228 | MACD Cross-Up Signal |
| WMT | Wal-Mart Stores, Inc. | 7/2/2019 | Bullish | 96.73 | 7010 | MACD Cross-Up Signal |
| WMT | Wal-Mart Stores, Inc. | 12/2/2019 | Bullish | 96.97 | 5881 | MACD Cross-Up Signal |
| ARMK | Aramark | 12/2/2019 | Bearish | 30.83 | 9472 | MACD Cross-Down ZeroLine |
| FB | Facebook, Inc. | 12/2/2019 | Bearish | 165.04 | 16292 | MACD Cross-Down Signal |
| MTCH | Match Group, Inc. | 7/2/2019 | Bearish | 55.76 | 9679 | MACD-H -ve Divergence |
| NEM | Newmont Mining Corporation | 12/2/2019 | Bearish | 33.39 | 5833 | MACD Cross-Down Signal |
| NLSN | Nielsen N.V. | 8/2/2019 | Bearish | 26.3 | 5682 | MACD-H -ve Divergence |
| SHOP | Shopify Inc. | 12/2/2019 | Bearish | 175.55 | 5928 | MACD Cross-Down Signal |
| TAP | Molson Coors Brewing Company | 12/2/2019 | Bearish | 59.19 | 7651 | MACD Cross-Down ZeroLine |
| USFD | US Foods Holding Corp. | 12/2/2019 | Bearish | 34.63 | 7527 | MACD Cross-Down Signal |
| VRNS | Varonis Systems, Inc. | 12/2/2019 | Bearish | 55.23 | 6769 | MACD Cross-Down Signal |
| ZAYO | Zayo Group Holdings, Inc. | 12/2/2019 | Bearish | 25.46 | 11163 | MACD Cross-Down ZeroLine |
Moses U.S. Stock MACD Scan
AmiBroker Academy.com
Disclaimer
The above result is for illustration purpose. It is not meant to be used for buy or sell decision. We do not recommend any particular stocks. If particular stocks of such are mentioned, they are meant as demonstration of Amibroker as a powerful charting software and MACD. Amibroker can program to scan the stocks for buy and sell signals.
These are script generated signals. Not all scan results are shown here. The MACD signal should use with price action. Users must understand what MACD and price action are all about before using them. If necessary you should attend a course to learn more on Technical Analysis (TA) and Moving Average Convergence Divergence, MACD.
Once again, the website does not guarantee any results or investment return based on the information and instruction you have read here. It should be used as learning aids only and if you decide to trade real money, all trading decision should be your own.