May 12, 2017
Frasers Centrepoint (FCL) reported a 42.2 per cent fall in Q2 net profit to S$71.2 million from S$123.3 million twelve months ago.
Read more about Frasers Centrepoint Q2 profit from The Straits Times, Frasers Centrepoint Q2 profit falls 42.2% due to timing of property.
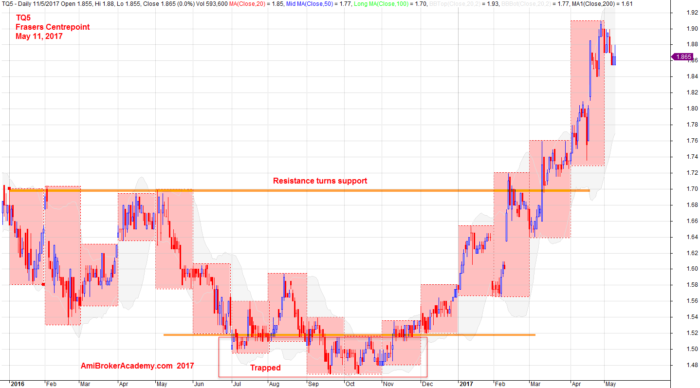
Breakout Higher the Key Level Frasers Centrepoint
Picture worth a thousand words. See the chart below, the Frasers Centrepoint stock price is breaking out higher from the key resistance.
2017 is a great year for Frasers Centrepoint. Many were trapped in 2016. But, the net profit fall, see the story above.
May 11, 2017 Frasers Centrepoint and Support Resistance
TQ5 Charting and MACD Indicator
Picture worth a thousand words. MACD Divergence.
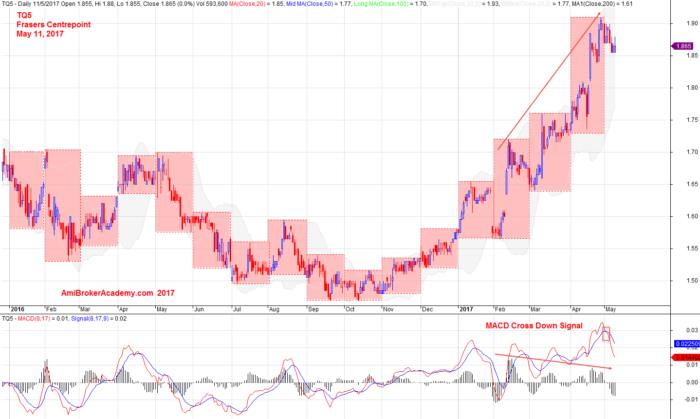
May 11, 2017 Frasers Centrepoint and MACD Indicator
Frasers Centrepoint Charting and EMA Wave
See chart for more, MA is a great visual tool. Price action cross up MA in last November. Since than the price is bounced off above the MA.
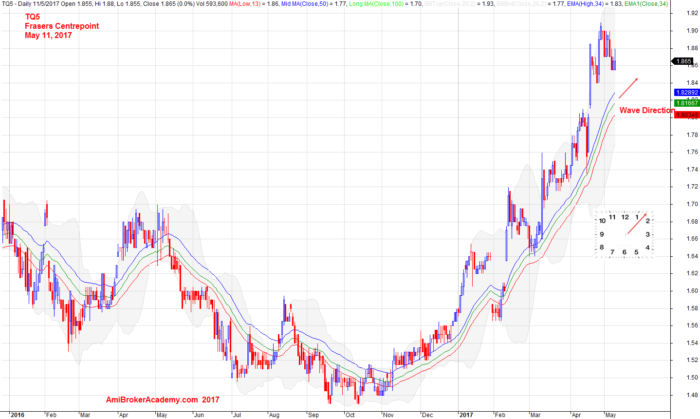
May 11, 2017 Frasers Centrepoint and EMA Wave
Frasers Centrepoint Charting Benchmark ST Index
What have you learn from the following benchmark?
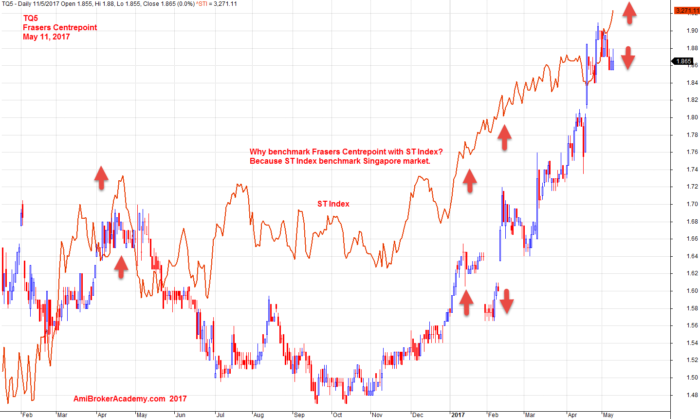
May 11, 2017 Frasers Centrepoint Benchmark ST Index
Frasers Centrepoint Charting Benchmark NASDAQ Index
Can you see any correlationship between Frasers Centrepoint and NASDAQ Index.
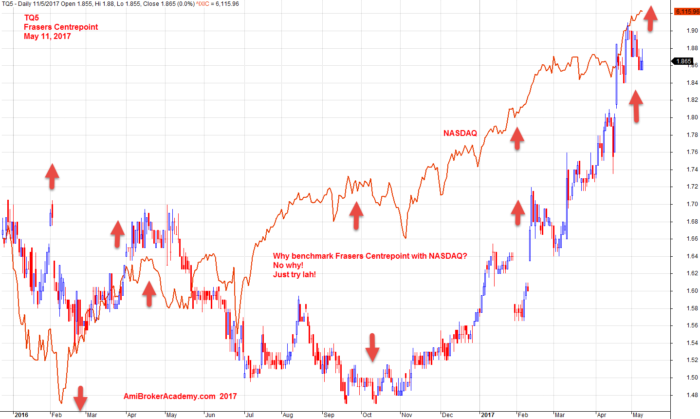
May 11, 2017 Frasers Centrepoint benchmark with NASDAQ Index
Moses Stock Analysis
AmiBrokerAcademy.com
Disclaimer
The above result is for illustration purpose. It is not meant to be used for buy or sell decision. We do not recommend any particular stocks. If particular stocks of such are mentioned, they are meant as demonstration of Amibroker as a powerful charting software and MACD. Amibroker can program to scan the stocks for buy and sell signals.
These are script generated signals. Not all scan results are shown here. The MACD signal should use with price action. Users must understand what MACD and price action are all about before using them. If necessary you should attend a course to learn more on Technical Analysis (TA) and Moving Average Convergence Divergence, MACD.
Once again, the website does not guarantee any results or investment return based on the information and instruction you have read here. It should be used as learning aids only and if you decide to trade real money, all trading decision should be your own.