14 April, 2019
Thanks for visiting the site.
Free U.S. Stock Five-day MACD Scan
Wht is AmiBroker AFL?
See the following link https://www.amibroker.com/guide/AFL.html on AmiBroker AFL.
What is MACD?
MACD stands for Moving Average Convergence Divergence, common setting is (12,26,9)
MACD indicator is a trend trading system that makes up of 2 lines. The MACD Line (fast line) and MACD Signal Line (slow line).
1) When the MACD Line crosses over the MACD Signal Line the trend is bullish. When the MACD Line crosses below the MACD Signal the trend is bearish.
2) When the MACD Line crosses above zero line the trend is bullish. When the MACD line crosses below zero line the trend is bearish.
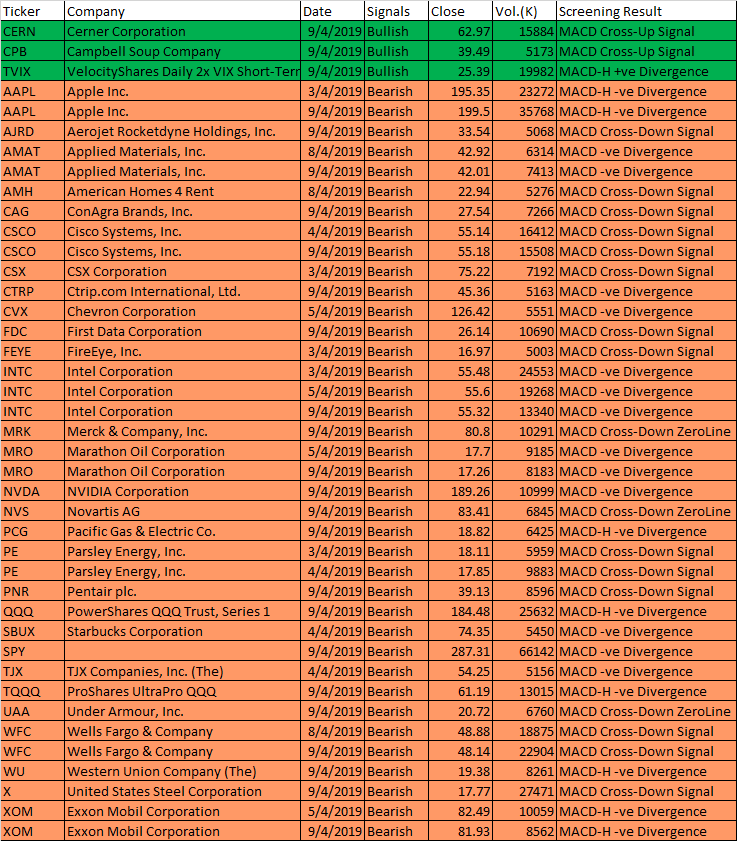
3 to 9 April 2019 AmiBroker AFL Script Generated Five-day U.S. Stock MACD Signals
The following are script generated Five-day U.S. Stock Market MACD signals using the Powerful AmiBroker’s AFL.
The MACD Setting used is (8,17,9)
| Ticker | Company | Date | Signals | Close | Vol.(K) | Screening Result |
| CERN | Cerner Corporation | 9/4/2019 | Bullish | 62.97 | 15884 | MACD Cross-Up Signal |
| CPB | Campbell Soup Company | 9/4/2019 | Bullish | 39.49 | 5173 | MACD Cross-Up Signal |
| TVIX | VelocityShares Daily 2x VIX Short-Term ETN | 9/4/2019 | Bullish | 25.39 | 19982 | MACD-H +ve Divergence |
| AAPL | Apple Inc. | 3/4/2019 | Bearish | 195.35 | 23272 | MACD-H -ve Divergence |
| AAPL | Apple Inc. | 9/4/2019 | Bearish | 199.5 | 35768 | MACD-H -ve Divergence |
| AJRD | Aerojet Rocketdyne Holdings, Inc. | 9/4/2019 | Bearish | 33.54 | 5068 | MACD Cross-Down Signal |
| AMAT | Applied Materials, Inc. | 8/4/2019 | Bearish | 42.92 | 6314 | MACD -ve Divergence |
| AMAT | Applied Materials, Inc. | 9/4/2019 | Bearish | 42.01 | 7413 | MACD -ve Divergence |
| AMH | American Homes 4 Rent | 8/4/2019 | Bearish | 22.94 | 5276 | MACD Cross-Down Signal |
| CAG | ConAgra Brands, Inc. | 9/4/2019 | Bearish | 27.54 | 7266 | MACD Cross-Down Signal |
| CSCO | Cisco Systems, Inc. | 4/4/2019 | Bearish | 55.14 | 16412 | MACD Cross-Down Signal |
| CSCO | Cisco Systems, Inc. | 9/4/2019 | Bearish | 55.18 | 15508 | MACD Cross-Down Signal |
| CSX | CSX Corporation | 3/4/2019 | Bearish | 75.22 | 7192 | MACD Cross-Down Signal |
| CTRP | Ctrip.com International, Ltd. | 9/4/2019 | Bearish | 45.36 | 5163 | MACD -ve Divergence |
| CVX | Chevron Corporation | 5/4/2019 | Bearish | 126.42 | 5551 | MACD -ve Divergence |
| FDC | First Data Corporation | 9/4/2019 | Bearish | 26.14 | 10690 | MACD Cross-Down Signal |
| FEYE | FireEye, Inc. | 3/4/2019 | Bearish | 16.97 | 5003 | MACD Cross-Down Signal |
| INTC | Intel Corporation | 3/4/2019 | Bearish | 55.48 | 24553 | MACD -ve Divergence |
| INTC | Intel Corporation | 5/4/2019 | Bearish | 55.6 | 19268 | MACD -ve Divergence |
| INTC | Intel Corporation | 9/4/2019 | Bearish | 55.32 | 13340 | MACD -ve Divergence |
| MRK | Merck & Company, Inc. | 9/4/2019 | Bearish | 80.8 | 10291 | MACD Cross-Down ZeroLine |
| MRO | Marathon Oil Corporation | 5/4/2019 | Bearish | 17.7 | 9185 | MACD -ve Divergence |
| MRO | Marathon Oil Corporation | 9/4/2019 | Bearish | 17.26 | 8183 | MACD -ve Divergence |
| NVDA | NVIDIA Corporation | 9/4/2019 | Bearish | 189.26 | 10999 | MACD -ve Divergence |
| NVS | Novartis AG | 9/4/2019 | Bearish | 83.41 | 6845 | MACD Cross-Down ZeroLine |
| PCG | Pacific Gas & Electric Co. | 9/4/2019 | Bearish | 18.82 | 6425 | MACD-H -ve Divergence |
| PE | Parsley Energy, Inc. | 3/4/2019 | Bearish | 18.11 | 5959 | MACD Cross-Down Signal |
| PE | Parsley Energy, Inc. | 4/4/2019 | Bearish | 17.85 | 9883 | MACD Cross-Down Signal |
| PNR | Pentair plc. | 9/4/2019 | Bearish | 39.13 | 8596 | MACD Cross-Down Signal |
| QQQ | PowerShares QQQ Trust, Series 1 | 9/4/2019 | Bearish | 184.48 | 25632 | MACD-H -ve Divergence |
| SBUX | Starbucks Corporation | 4/4/2019 | Bearish | 74.35 | 5450 | MACD -ve Divergence |
| SPY | 9/4/2019 | Bearish | 287.31 | 66142 | MACD -ve Divergence | |
| TJX | TJX Companies, Inc. (The) | 4/4/2019 | Bearish | 54.25 | 5156 | MACD -ve Divergence |
| TQQQ | ProShares UltraPro QQQ | 9/4/2019 | Bearish | 61.19 | 13015 | MACD-H -ve Divergence |
| UAA | Under Armour, Inc. | 9/4/2019 | Bearish | 20.72 | 6760 | MACD Cross-Down ZeroLine |
| WFC | Wells Fargo & Company | 8/4/2019 | Bearish | 48.88 | 18875 | MACD Cross-Down Signal |
| WFC | Wells Fargo & Company | 9/4/2019 | Bearish | 48.14 | 22904 | MACD Cross-Down Signal |
| WU | Western Union Company (The) | 9/4/2019 | Bearish | 19.38 | 8261 | MACD-H -ve Divergence |
| X | United States Steel Corporation | 9/4/2019 | Bearish | 17.77 | 27471 | MACD Cross-Down Signal |
| XOM | Exxon Mobil Corporation | 5/4/2019 | Bearish | 82.49 | 10059 | MACD-H -ve Divergence |
| XOM | Exxon Mobil Corporation | 9/4/2019 | Bearish | 81.93 | 8562 | MACD-H -ve Divergence |
Moses U.S. Stock MACD Scan
AmiBroker Academy.com
Disclaimer
The above result is for illustration purpose. It is not meant to be used for buy or sell decision. We do not recommend any particular stocks. If particular stocks of such are mentioned, they are meant as demonstration of Amibroker as a powerful charting software and MACD. Amibroker can program to scan the stocks for buy and sell signals.
These are script generated signals. Not all scan results are shown here. The MACD signal should use with price action. Users must understand what MACD and price action are all about before using them. If necessary you should attend a course to learn more on Technical Analysis (TA) and Moving Average Convergence Divergence, MACD.
Once again, the website does not guarantee any results or investment return based on the information and instruction you have read here. It should be used as learning aids only and if you decide to trade real money, all trading decision should be your own.