23 November, 2018
Thanks for visiting the site.
Free U.S. Stock Five-day MACD Scan
Wht is AmiBroker AFL?
See the following link https://www.amibroker.com/guide/AFL.html on AmiBroker AFL.
What is MACD?
MACD stands for Moving Average Convergence Divergence, common setting is (12,26,9)
MACD indicator is a trend trading system that makes up of 2 lines. The MACD Line (fast line) and MACD Signal Line (slow line).
1) When the MACD Line crosses over the MACD Signal Line the trend is bullish. When the MACD Line crosses below the MACD Signal the trend is bearish.
2) When the MACD Line crosses above zero line the trend is bullish. When the MACD line crosses below zero line the trend is bearish.
MACD Exampe – A Agilent Technologies Inc
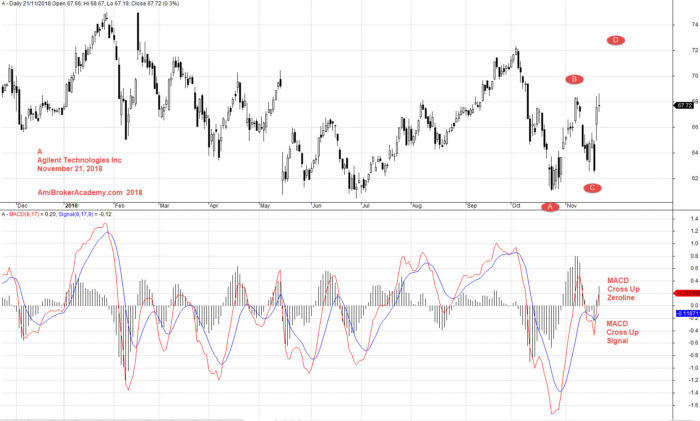
November 21, 2018 Agilent Technologies Inc and MACD
15 to 21 November 2018 AFL Script Generated Five-day U.S. Stock MACD Signals
The following are script generated Five-day U.S. Stock Market MACD signals using the Powerful AmiBroker’s AFL.
The MACD Setting used is (8,17,9)
| Ticker | Company | Date | Bull/Bear | Close | Vol.(K) | Screening Result |
| A | Agilent Technologies, Inc. | 20/11/2018 | Bull | 67.52 | 8187 | MACD Cross-Up ZeroLine |
| AMZN | Amazon.com, Inc. | 16/11/2018 | Bull | 1593.41 | 6066 | MACD-H +ve Divergence |
| AMZN | Amazon.com, Inc. | 21/11/2018 | Bull | 1516.73 | 5712 | MACD-H +ve Divergence |
| BECN | Beacon Roofing Supply, Inc. | 21/11/2018 | Bull | 32.81 | 5556 | MACD Cross-Up ZeroLine |
| BP | BP p.l.c. | 15/11/2018 | Bull | 41.16 | 7654 | MACD Cross-Up Signal |
| BP | BP p.l.c. | 19/11/2018 | Bull | 40.92 | 6202 | MACD Cross-Up Signal |
| BP | BP p.l.c. | 20/11/2018 | Bull | 40.1 | 8433 | MACD Cross-Up Signal |
| BP | BP p.l.c. | 21/11/2018 | Bull | 41.27 | 8279 | MACD Cross-Up Signal |
| CELG | Celgene Corporation | 16/11/2018 | Bull | 69.65 | 9271 | MACD-H +ve Divergence |
| CELG | Celgene Corporation | 19/11/2018 | Bull | 69.4 | 6758 | MACD-H +ve Divergence |
| CELG | Celgene Corporation | 20/11/2018 | Bull | 66.75 | 7874 | MACD-H +ve Divergence |
| CELG | Celgene Corporation | 21/11/2018 | Bull | 67.54 | 6460 | MACD-H +ve Divergence |
| CFX | Colfax Corporation | 19/11/2018 | Bull | 23.72 | 5806 | MACD-H +ve Divergence |
| CNQ | Canadian Natural Resources Limited | 19/11/2018 | Bull | 27.2 | 5307 | MACD-H +ve Divergence |
| CRM | Salesforce.com Inc | 15/11/2018 | Bull | 132.49 | 6469 | MACD-H +ve Divergence |
| CRM | Salesforce.com Inc | 21/11/2018 | Bull | 123.59 | 7300 | MACD-H +ve Divergence |
| CTRP | Ctrip.com International, Ltd. | 21/11/2018 | Bull | 26.99 | 7120 | MACD Cross-Up Signal |
| DVN | Devon Energy Corporation | 21/11/2018 | Bull | 28.53 | 6299 | MACD-H +ve Divergence |
| EBAY | eBay Inc. | 21/11/2018 | Bull | 28.34 | 12092 | MACD Cross-Up Signal |
| FL | Foot Locker, Inc. | 20/11/2018 | Bull | 46.09 | 6865 | MACD Cross-Up ZeroLine |
| FL | Foot Locker, Inc. | 21/11/2018 | Bull | 52.96 | 14397 | MACD Cross-Up ZeroLine |
| GPS | Gap, Inc. (The) | 21/11/2018 | Bull | 25.81 | 6933 | MACD +ve Divergence |
| HAL | Halliburton Company | 16/11/2018 | Bull | 32.46 | 7905 | MACD +ve Divergence |
| HAL | Halliburton Company | 19/11/2018 | Bull | 32.99 | 12195 | MACD +ve Divergence |
| HAL | Halliburton Company | 21/11/2018 | Bull | 31.93 | 5358 | MACD +ve Divergence |
| LOW | Lowe’s Companies, Inc. | 21/11/2018 | Bull | 88.37 | 7345 | MACD-H +ve Divergence |
| LVS | Las Vegas Sands Corp. | 15/11/2018 | Bull | 53.73 | 5811 | MACD-H +ve Divergence |
| LVS | Las Vegas Sands Corp. | 19/11/2018 | Bull | 50.45 | 5103 | MACD-H +ve Divergence |
| MDT | Medtronic plc | 16/11/2018 | Bull | 93.7 | 7922 | MACD Cross-Up Signal |
| MDT | Medtronic plc | 19/11/2018 | Bull | 90.37 | 6781 | MACD Cross-Up Signal |
| MDT | Medtronic plc | 21/11/2018 | Bull | 92.97 | 6829 | MACD Cross-Up Signal |
| MPC | Marathon Petroleum Corporation | 15/11/2018 | Bull | 65.36 | 6150 | MACD-H +ve Divergence |
| MPC | Marathon Petroleum Corporation | 20/11/2018 | Bull | 61.89 | 7603 | MACD-H +ve Divergence |
| MPC | Marathon Petroleum Corporation | 21/11/2018 | Bull | 63.73 | 6439 | MACD-H +ve Divergence |
| NBL | Noble Energy Inc. | 15/11/2018 | Bull | 25.5 | 6183 | MACD +ve Divergence |
| NBL | Noble Energy Inc. | 20/11/2018 | Bull | 23.71 | 7141 | MACD +ve Divergence |
| NBL | Noble Energy Inc. | 21/11/2018 | Bull | 24.48 | 5319 | MACD +ve Divergence |
| NKE | Nike, Inc. | 15/11/2018 | Bull | 74.33 | 7858 | MACD-H +ve Divergence |
| NKE | Nike, Inc. | 21/11/2018 | Bull | 72.37 | 7326 | MACD-H +ve Divergence |
| QCOM | QUALCOMM Incorporated | 21/11/2018 | Bull | 55.27 | 13013 | MACD Cross-Up Signal |
| SU | Suncor Energy Inc. | 20/11/2018 | Bull | 32.17 | 7529 | MACD-H +ve Divergence |
| SU | Suncor Energy Inc. | 21/11/2018 | Bull | 33.6 | 5371 | MACD-H +ve Divergence |
| SYF | Synchrony Financial | 16/11/2018 | Bull | 25.91 | 9307 | MACD-H +ve Divergence |
| TJX | TJX Companies, Inc. (The) | 21/11/2018 | Bull | 46.16 | 10857 | MACD Cross-Up Signal |
| TSM | Taiwan Semiconductor Manufacturing Company Ltd. | 19/11/2018 | Bull | 36.05 | 15192 | MACD-H +ve Divergence |
| TSM | Taiwan Semiconductor Manufacturing Company Ltd. | 21/11/2018 | Bull | 36.17 | 7013 | MACD-H +ve Divergence |
| ABT | Abbott Laboratories | 16/11/2018 | Bear | 72.04 | 9861 | MACD Cross-Down ZeroLine |
| ABT | Abbott Laboratories | 19/11/2018 | Bear | 70.54 | 7224 | MACD Cross-Down ZeroLine |
| ABT | Abbott Laboratories | 21/11/2018 | Bear | 68.53 | 5788 | MACD Cross-Down ZeroLine |
| CNP | CenterPoint Energy, Inc. | 15/11/2018 | Bear | 27.55 | 6090 | MACD Cross-Down Signal |
| DWDP | DowDuPont Inc. | 21/11/2018 | Bear | 56.97 | 9070 | MACD Cross-Down Signal |
| ESRX | Express Scripts Holding Company | 21/11/2018 | Bear | 95.33 | 6371 | MACD Cross-Down ZeroLine |
| FE | FirstEnergy Corporation | 19/11/2018 | Bear | 38.54 | 5198 | MACD Cross-Down Signal |
| GIS | General Mills, Inc. | 19/11/2018 | Bear | 44.23 | 6876 | MACD Cross-Down ZeroLine |
| JNJ | Johnson & Johnson | 20/11/2018 | Bear | 146.45 | 8938 | MACD Cross-Down Signal |
| JNJ | Johnson & Johnson | 21/11/2018 | Bear | 141.99 | 10275 | MACD Cross-Down Signal |
| JPM | J P Morgan Chase & Co | 21/11/2018 | Bear | 107.64 | 10619 | MACD Cross-Down Signal |
| LB | L Brands, Inc. | 21/11/2018 | Bear | 29.37 | 10929 | MACD Cross-Down ZeroLine |
| MET | MetLife, Inc. | 19/11/2018 | Bear | 43.67 | 7902 | MACD Cross-Down ZeroLine |
| MET | MetLife, Inc. | 21/11/2018 | Bear | 42.99 | 6578 | MACD Cross-Down ZeroLine |
| MRK | Merck & Company, Inc. | 20/11/2018 | Bear | 74.78 | 13588 | MACD Cross-Down Signal |
| MRK | Merck & Company, Inc. | 21/11/2018 | Bear | 74.79 | 9055 | MACD Cross-Down Signal |
| PFE | Pfizer, Inc. | 19/11/2018 | Bear | 44.18 | 22459 | MACD Cross-Down Signal |
| PFE | Pfizer, Inc. | 21/11/2018 | Bear | 43.1 | 18658 | MACD Cross-Down Signal |
| TWTR | Twitter, Inc. | 21/11/2018 | Bear | 31.61 | 16465 | MACD Cross-Down ZeroLine |
| VZ | Verizon Communications Inc. | 21/11/2018 | Bear | 59.16 | 18482 | MACD Cross-Down Signal |
if you can see the full chart, “press Ctrl and -” to zoom out and see the entire chart.
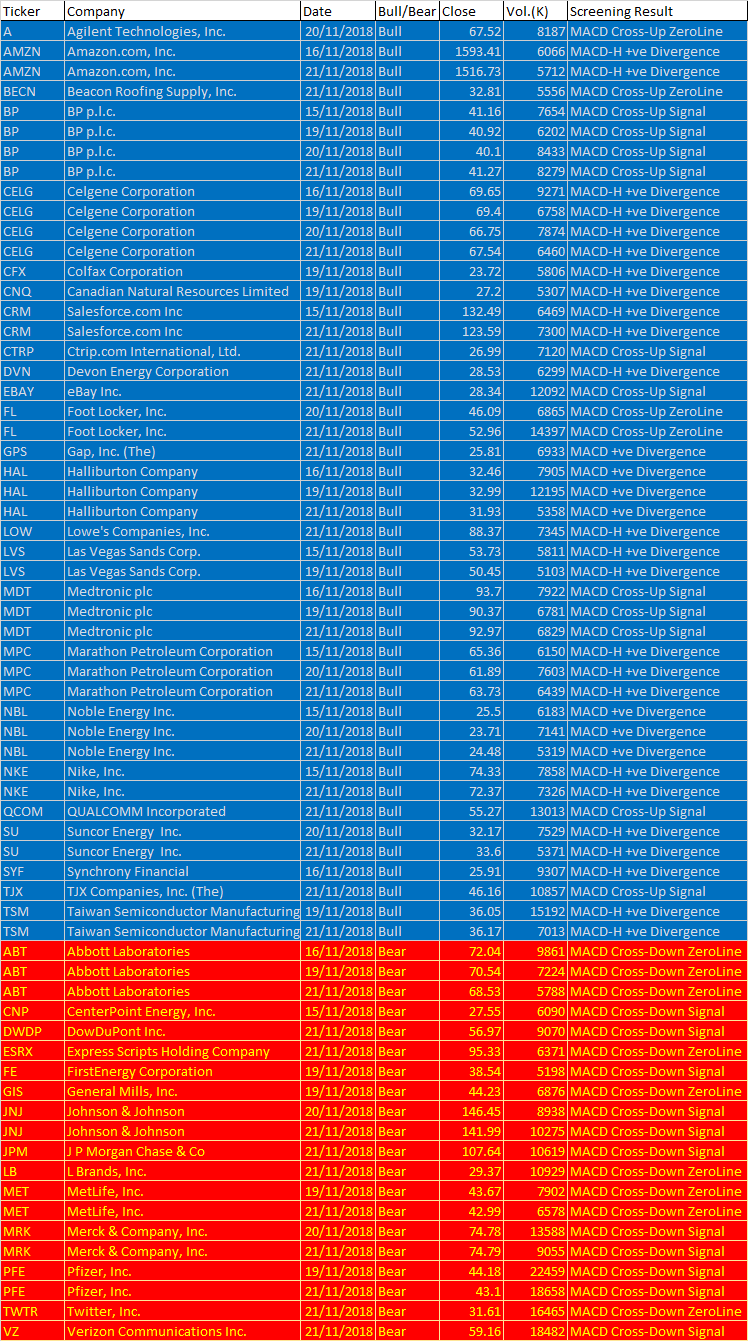
November 15 to 21, 2018 US Stock Five-day MACD Screener Results
Moses U.S. Stock MACD Scan
AmiBroker Academy.com
Disclaimer
The above result is for illustration purpose. It is not meant to be used for buy or sell decision. We do not recommend any particular stocks. If particular stocks of such are mentioned, they are meant as demonstration of Amibroker as a powerful charting software and MACD. Amibroker can program to scan the stocks for buy and sell signals.
These are script generated signals. Not all scan results are shown here. The MACD signal should use with price action. Users must understand what MACD and price action are all about before using them. If necessary you should attend a course to learn more on Technical Analysis (TA) and Moving Average Convergence Divergence, MACD.
Once again, the website does not guarantee any results or investment return based on the information and instruction you have read here. It should be used as learning aids only and if you decide to trade real money, all trading decision should be your own.