28 August 2021
Welcome!
Welcome to AmiBroker Academy dot com, amibrokeracademy.com.
This not a site for those whom just want to know, buy or sell signals. We don’t provide, we provide you the thought. You can decide when to buy and sell and take responsibility.
Trading is all about observation, trade what you see reading the price bar by bar and not checking the news.
By the time you hear the news it is already old and become history. Why? It is very simple, remember where the news come from? It has first someone read the chart and project the change in price action direction. They release their thought to the news agency like CNBC, and so on. Next, someone has to read the news to you after some research and summarize. This will be few hours later, by then the price action has already move.
As for price bar, it is what the market supply and remand. When market feel that is over price, the price will drop. All this reflected on the price bar almost instantly.
Next is how to read our price bar plus using some tools, such as MACD.
Here, we simply translate price action chart into layman language. This will help you in understand the financial instrument you are trading. We believe picture worth a thousand words. So, sometimes we use less words. You can learn the price action interpretation too. Give it a tray. You may not have the same view points as us. Remember all analysis read price action chart differently. It is just like reading an essay, we will have different conclusion.
Trade well.
Trade what you see. Manage your risk.
1) Kuaishou Technology 快手科技 and Ichimoku Cloud
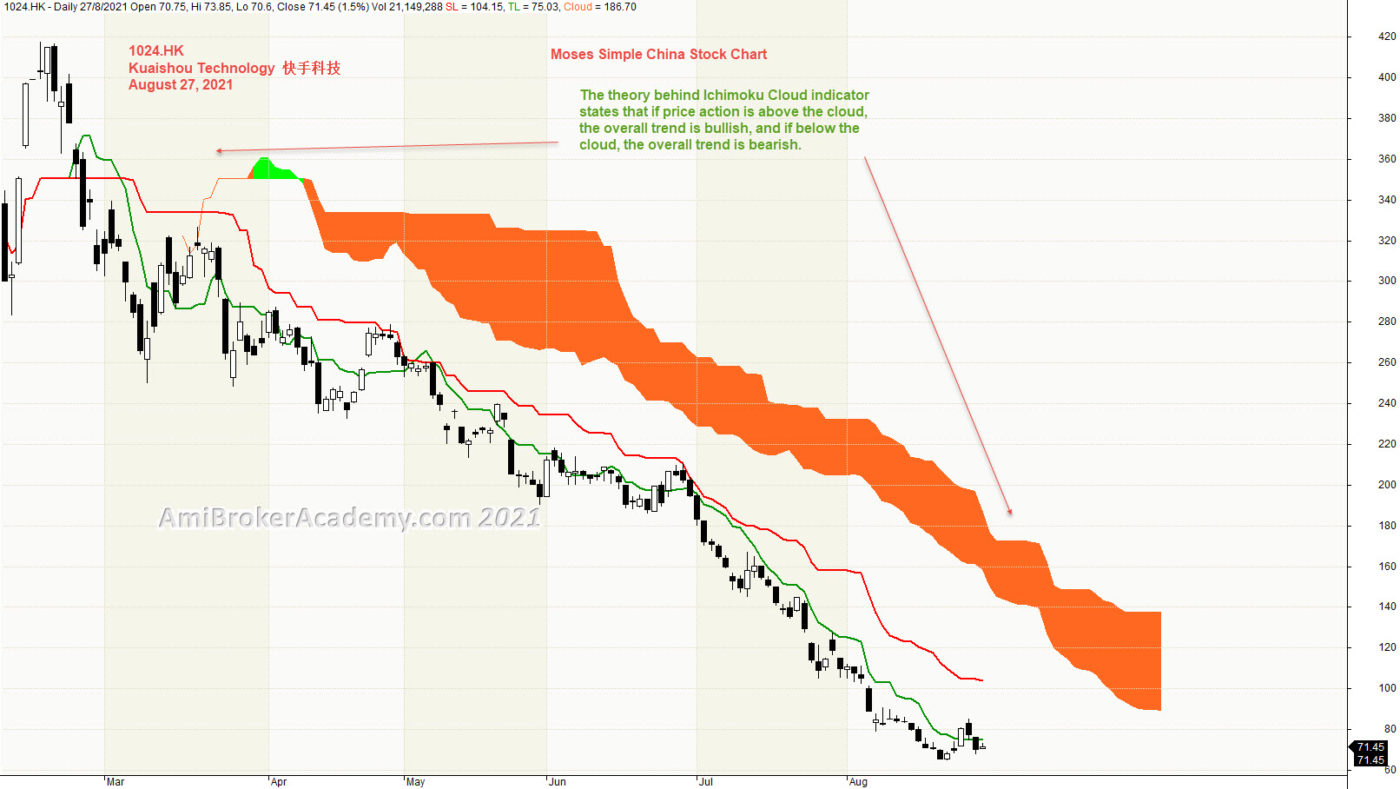
Ichimoku Cloud is a trend following strategy tool, can be used in any market and any timeframe.
Using Ichimoku indicator is to emphasize to trade in the trend direction.
The theory behind Ichimoku Cloud indicator states that if price action is above the cloud, the overall trend is bullish, and if below the cloud, the overall trend is bearish.
For the current chart, the trend is in bear trend. For short term maybe to stand aside to wait for price action begin to reverse then look for confirmation before buy.
Don’t play play with Ichimoku indicator. Very simple. Yet powerful. AmiBrokerAcademy provides you simple yet easy to understand stock chart. Check out Moses power stock chart.
2) Kuaishou Technology 快手科技 and Bollinger Bands and Moving Averages
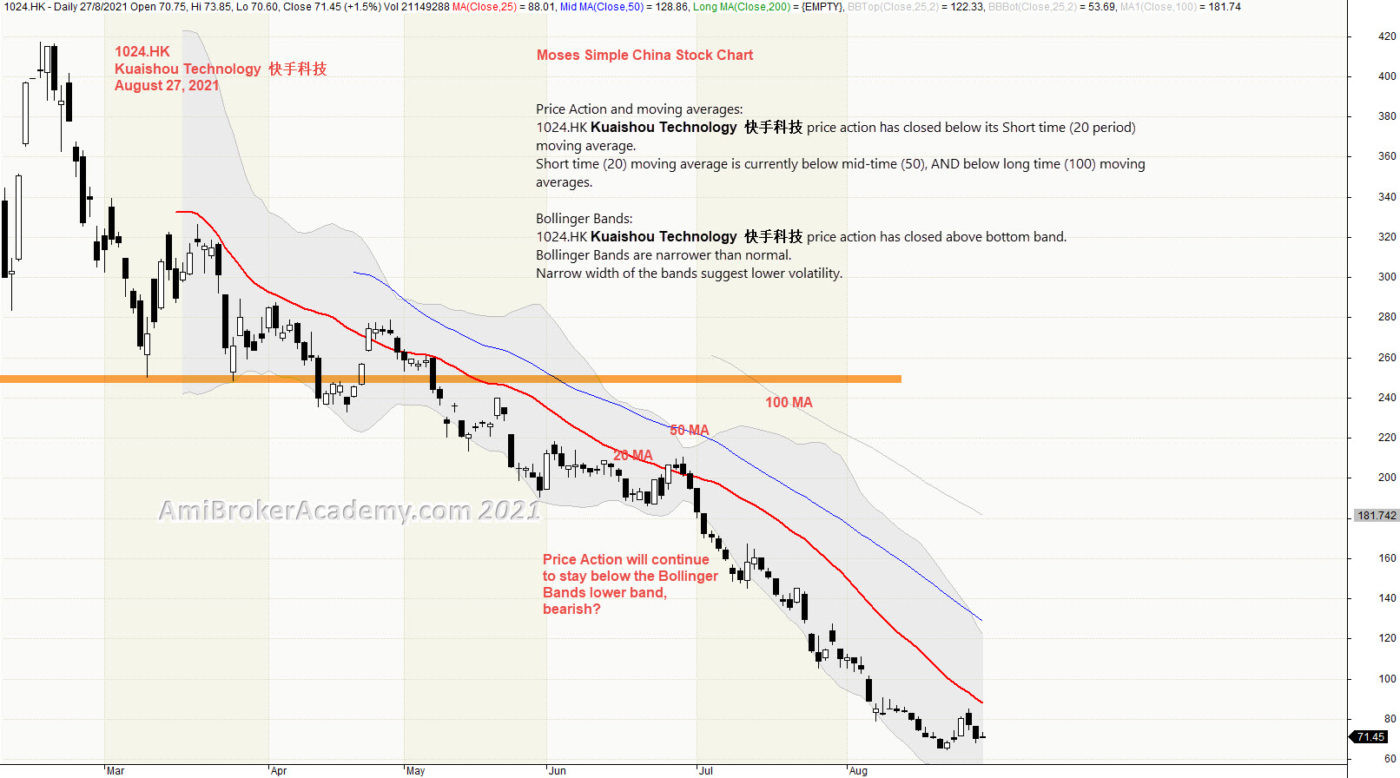
Price Action and moving averages:
1024.HK Kuaishou Technology 快手科技 price action has closed below its Short time (20 period) moving average.
Short time (20) moving average is currently below mid-time (50), AND below long time (100) moving averages.
Bollinger Bands:
1024.HK Kuaishou Technology 快手科技 price action has closed above bottom band.
Bollinger Bands are narrower than normal.
Narrow width of the bands suggest lower volatility.
Trade what you see. Mange your risk.
3) Kuaishou Technology 快手科技 and Moving Averages
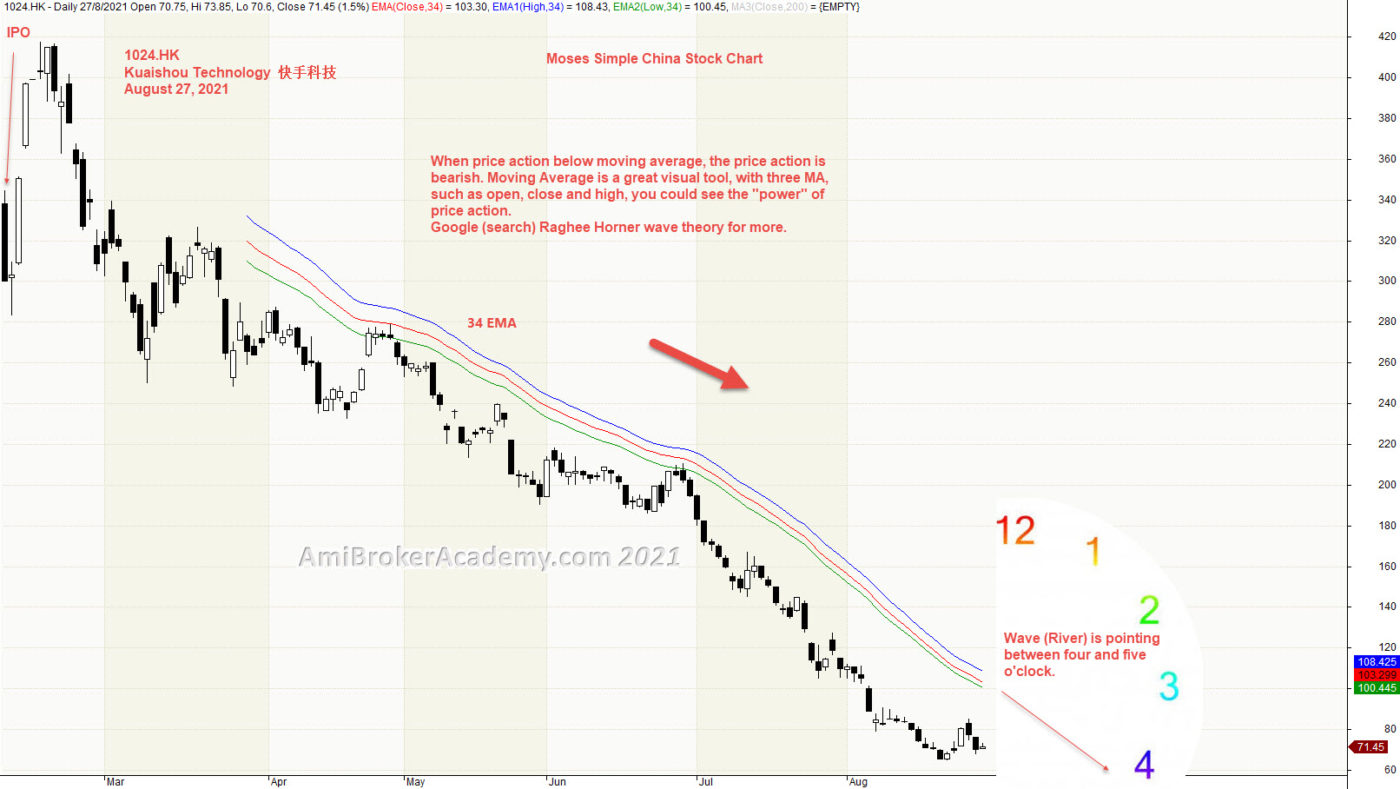
Price Action is pointing to four and five o’clock direction, price action continues to go south (down). See chart.
Moving Average is a great visual tool. Raghee uses high, low and close of 34 EMA to form a band to determine the wave direction. Price action goes from below 34 EMA to above River and deep down again.
River is a great support resistance tool. Now, price action is resisted by River.
To learn more, you can google (search) Raghee Horner wave theory for more.
Manage your risk.
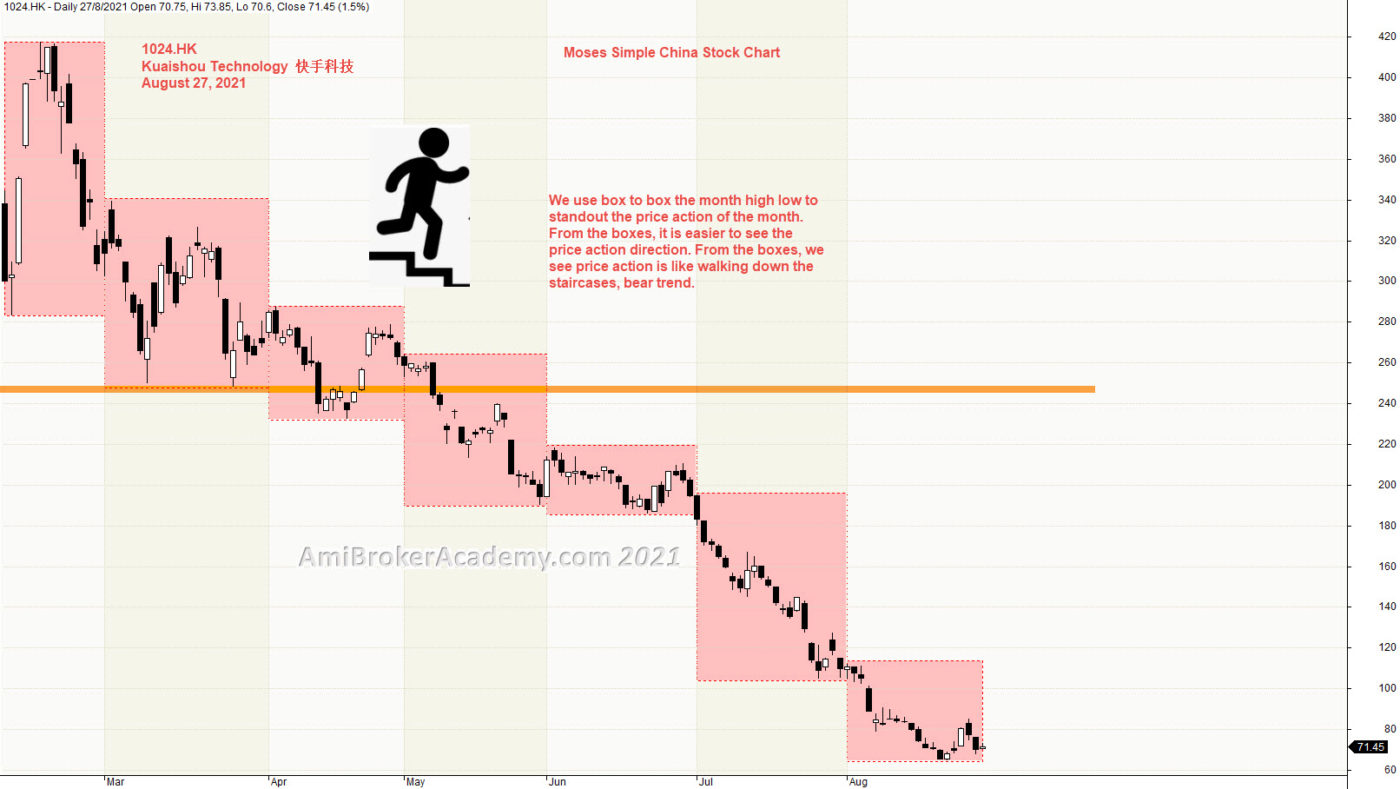
4) Kuaishou Technology 快手科技 and Price Action and Boxes
Picture worth a thousand words. See chart, walking down the steps, bearish trend.
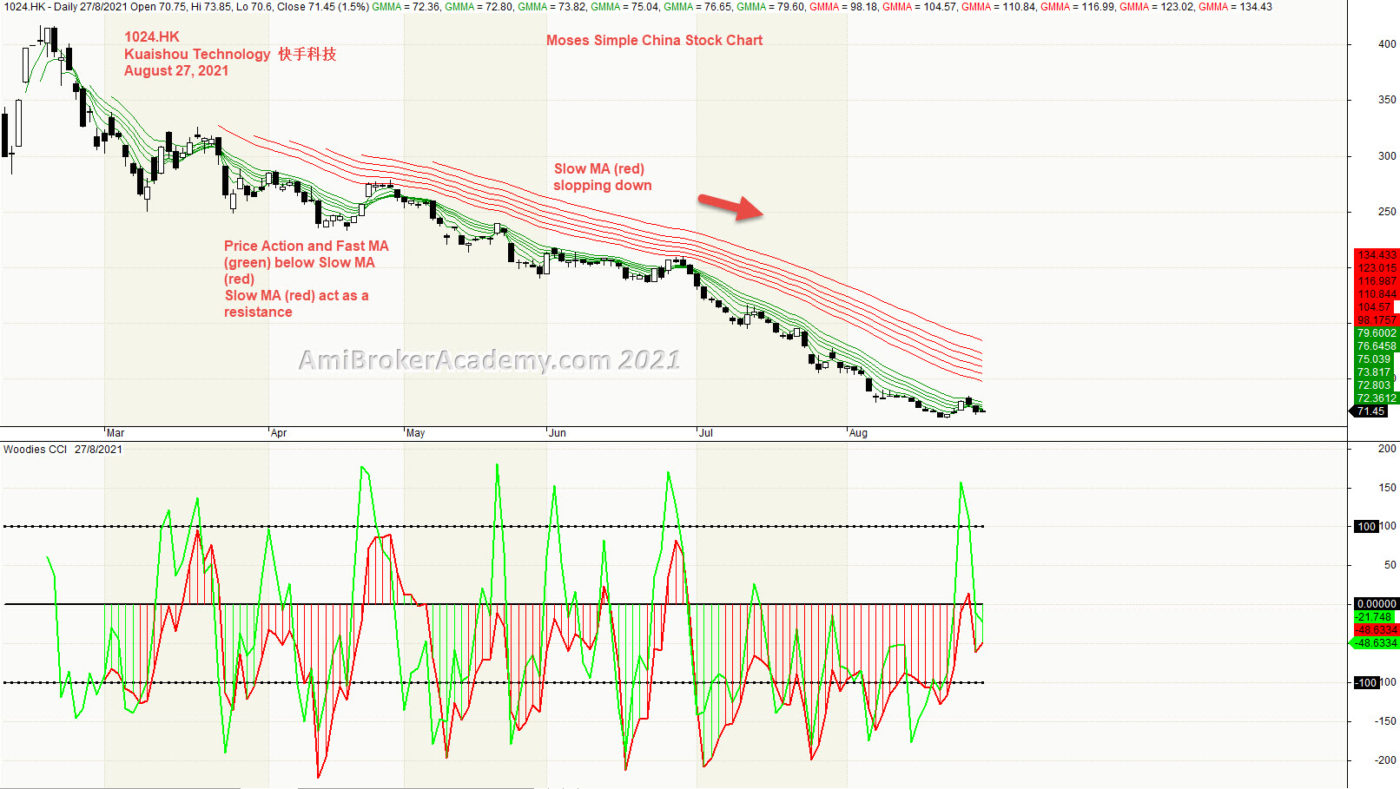
5) Kuaishou Technology 快手科技 and GMMA and Woodies CCI
See chart, picture worth a thousand words.
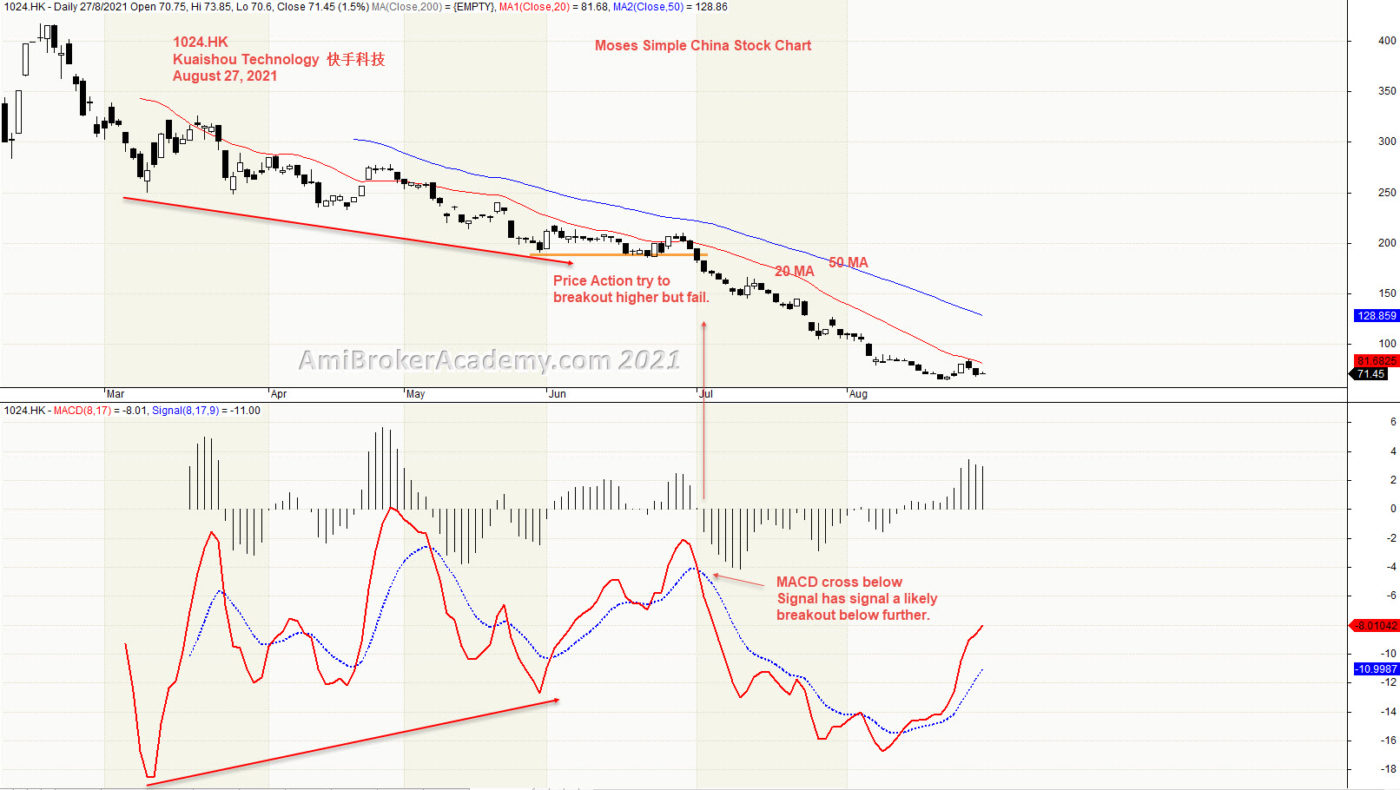
6) Kuaishou Technology 快手科技 and MACD
MACD Divergence.
Moses Power Charting
Official AmiBrokerAcademy.com Charting
Disclaimer
The above result is for illustration purpose. It is not meant to be used for buy or sell decision. We do not recommend any particular stocks. If particular stocks of such are mentioned, they are meant as demonstration of Amibroker as a powerful charting software and MACD. Amibroker can program to scan the stocks for buy and sell signals.
These are script generated signals. Not all scan results are shown here. The MACD signal should use with price action. Users must understand what MACD and price action are all about before using them. If necessary you should attend a course to learn more on Technical Analysis (TA) and Moving Average Convergence Divergence, MACD.
Once again, the website does not guarantee any results or investment return based on the information and instruction you have read here. It should be used as learning aids only and if you decide to trade real money, all trading decision should be your own.
We learn from many past and present great traders. Kudo to these master.