November 27, 2017
Warren Buffett’s Rules in Investment
You know, this is what I was told Warren Buffett’s two rules of investing.
Rule number one don’t lose money. Rule number two don’t violate rule number one.
But, I have to say I do not know him, as I have never met him before. My understanding is to have launch with him I have to pay a lot of money. …
If you want to learn, you have to pay money. So many traders have paid for their hands-on day after day.
Today, everyone want to learn from Jack Ma on their online business. This is probably true for many want to learn from Warren Buffett.
Bond Rating
Most bonds carry a rating from one of the three independent finance rating agencies, namely Standard & Poor’s, Moody’s, and Fitch. These agencies conduct a thorough financial analysis of the entity that is issuing the bond.
They base upon their own rating criteria. These agency’s use their set criteria, analysts determine the entity’s ability to pay their bills and remain liquid and assign a credit rating to the bond.
^TNX 10-Year US Treasury Note and Its Trends
For the last sixteen months, you can see the 10-Year US Treasury Note has gone rally, to sideways to decline. See chart for more. Government bonds are rated AAA most of the time.
The following chart is plot by AmiBroker charting software. AmiBroker is a powerful charting software.
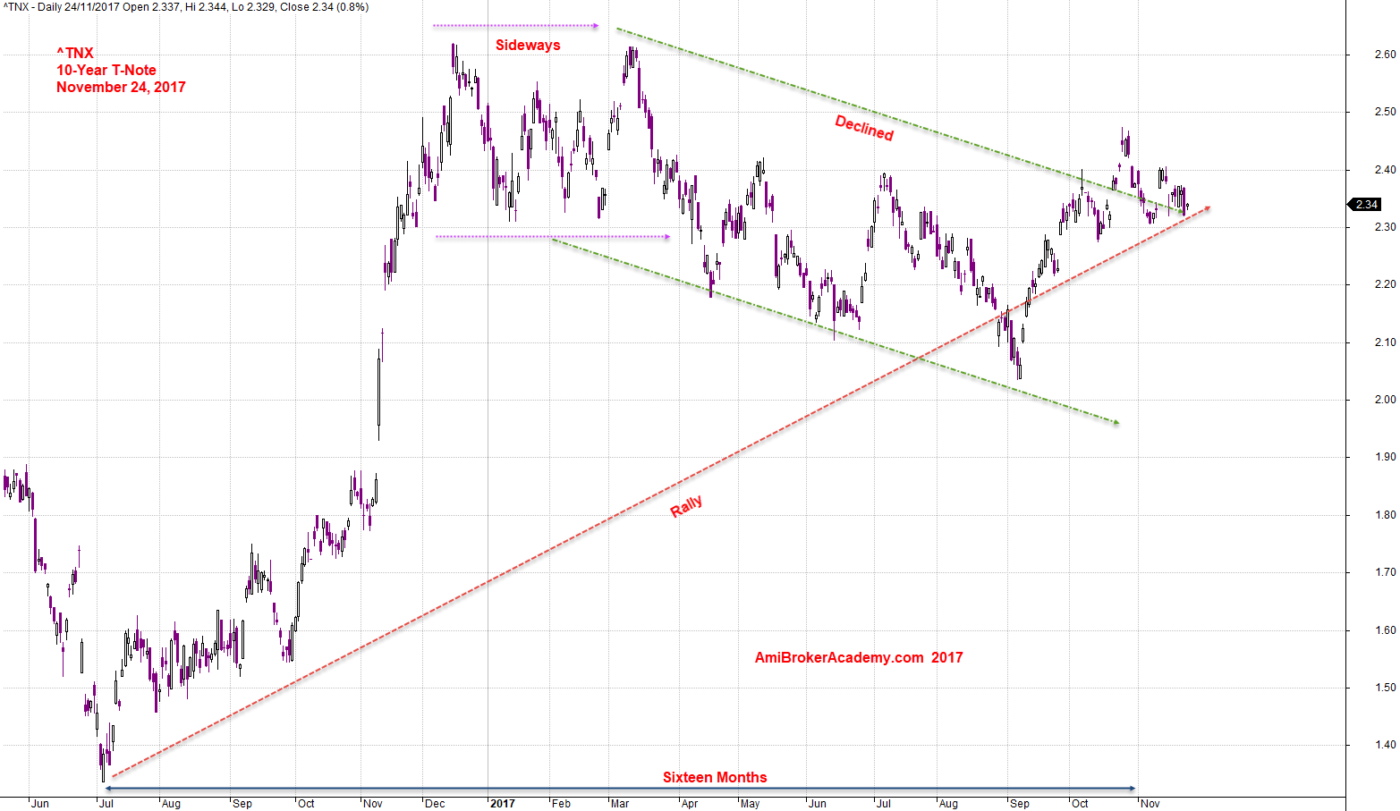
November 24, 2017 US 10 Year Treasury Note and Its Trends
HM Gartley ABCD Pattern, Support Resistance, Channel and Moving Average are great tool to reference for trade. Have fun!
Moses
AmiBrokerAcademy.com
Disclaimer
The above result is for illustration purpose. It is not meant to be used for buy or sell decision. We do not recommend any particular stocks. If particular stocks of such are mentioned, they are meant as demonstration of Amibroker as a powerful charting software and MACD. Amibroker can program to scan the stocks for buy and sell signals.
These are script generated signals. Not all scan results are shown here. The MACD signal should use with price action. Users must understand what MACD and price action are all about before using them. If necessary you should attend a course to learn more on Technical Analysis (TA) and Moving Average Convergence Divergence, MACD.
Once again, the website does not guarantee any results or investment return based on the information and instruction you have read here. It should be used as learning aids only and if you decide to trade real money, all trading decision should be your own.