2 March 2019
Thanks for visiting the site.
Free U.S. Stock MACD Screener
What is MACD?
MACD stands for Moving Average Convergence Divergence, common setting is (12,26,9)
MACD indicator is a trend trading system that makes up of 2 lines. The MACD Line (fast line) and MACD Signal Line (slow line).
1) When the MACD Line crosses over the MACD Signal Line the trend is bullish. When the MACD Line crosses below the MACD Signal the trend is bearish.
2) When the MACD Line crosses above zero line the trend is bullish. When the MACD line crosses below zero line the trend is bearish.
What is AmiBroker AFL?
AmiBroker AFL stands for AmiBroker Formula Language.
AmiBroker equips with a powerful formula language allowing you to write trading system rules, define your own indicators and custom commentaries, such as the MACD Screener Script here.
Read more on the following link, https://www.amibroker.com/guide/AFL.html.
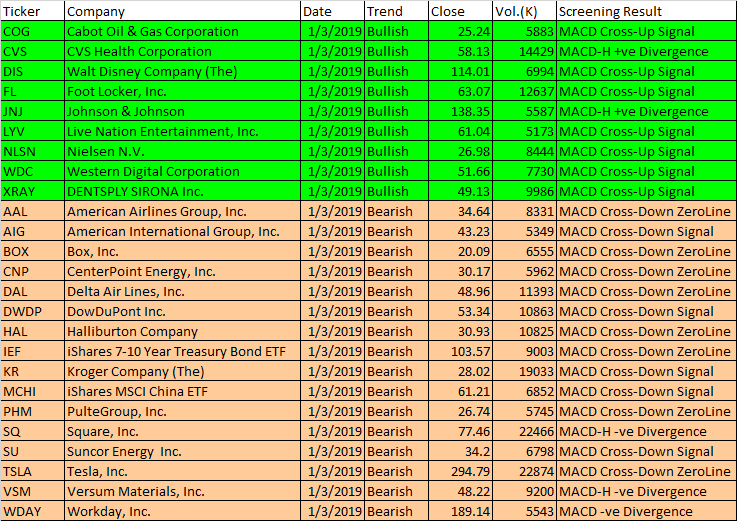
1 March 2019 AFL Script Generated One-day U.S. Stock MACD Signals
The following are script generated One-day U.S. Stock Market MACD signals using the Powerful AmiBroker’s AFL.
The MACD Setting used is (8,17,9)
| Ticker | Company | Date | Trend | Close | Vol.(K) | Screening Result |
| COG | Cabot Oil & Gas Corporation | 1/3/2019 | Bullish | 25.24 | 5883 | MACD Cross-Up Signal |
| CVS | CVS Health Corporation | 1/3/2019 | Bullish | 58.13 | 14429 | MACD-H +ve Divergence |
| DIS | Walt Disney Company (The) | 1/3/2019 | Bullish | 114.01 | 6994 | MACD Cross-Up Signal |
| FL | Foot Locker, Inc. | 1/3/2019 | Bullish | 63.07 | 12637 | MACD Cross-Up Signal |
| JNJ | Johnson & Johnson | 1/3/2019 | Bullish | 138.35 | 5587 | MACD-H +ve Divergence |
| LYV | Live Nation Entertainment, Inc. | 1/3/2019 | Bullish | 61.04 | 5173 | MACD Cross-Up Signal |
| NLSN | Nielsen N.V. | 1/3/2019 | Bullish | 26.98 | 8444 | MACD Cross-Up Signal |
| WDC | Western Digital Corporation | 1/3/2019 | Bullish | 51.66 | 7730 | MACD Cross-Up Signal |
| XRAY | DENTSPLY SIRONA Inc. | 1/3/2019 | Bullish | 49.13 | 9986 | MACD Cross-Up Signal |
| AAL | American Airlines Group, Inc. | 1/3/2019 | Bearish | 34.64 | 8331 | MACD Cross-Down ZeroLine |
| AIG | American International Group, Inc. | 1/3/2019 | Bearish | 43.23 | 5349 | MACD Cross-Down Signal |
| BOX | Box, Inc. | 1/3/2019 | Bearish | 20.09 | 6555 | MACD Cross-Down ZeroLine |
| CNP | CenterPoint Energy, Inc. | 1/3/2019 | Bearish | 30.17 | 5962 | MACD Cross-Down ZeroLine |
| DAL | Delta Air Lines, Inc. | 1/3/2019 | Bearish | 48.96 | 11393 | MACD Cross-Down ZeroLine |
| DWDP | DowDuPont Inc. | 1/3/2019 | Bearish | 53.34 | 10863 | MACD Cross-Down Signal |
| HAL | Halliburton Company | 1/3/2019 | Bearish | 30.93 | 10825 | MACD Cross-Down ZeroLine |
| IEF | iShares 7-10 Year Treasury Bond ETF | 1/3/2019 | Bearish | 103.57 | 9003 | MACD Cross-Down ZeroLine |
| KR | Kroger Company (The) | 1/3/2019 | Bearish | 28.02 | 19033 | MACD Cross-Down Signal |
| MCHI | iShares MSCI China ETF | 1/3/2019 | Bearish | 61.21 | 6852 | MACD Cross-Down Signal |
| PHM | PulteGroup, Inc. | 1/3/2019 | Bearish | 26.74 | 5745 | MACD Cross-Down ZeroLine |
| SQ | Square, Inc. | 1/3/2019 | Bearish | 77.46 | 22466 | MACD-H -ve Divergence |
| SU | Suncor Energy Inc. | 1/3/2019 | Bearish | 34.2 | 6798 | MACD Cross-Down Signal |
| TSLA | Tesla, Inc. | 1/3/2019 | Bearish | 294.79 | 22874 | MACD Cross-Down ZeroLine |
| VSM | Versum Materials, Inc. | 1/3/2019 | Bearish | 48.22 | 9200 | MACD-H -ve Divergence |
| WDAY | Workday, Inc. | 1/3/2019 | Bearish | 189.14 | 5543 | MACD -ve Divergence |
Moses U.S. Stock MACD Scan
AmiBroker Academy.com
Disclaimer
The above result is for illustration purpose. It is not meant to be used for buy or sell decision. We do not recommend any particular stocks. If particular stocks of such are mentioned, they are meant as demonstration of Amibroker as a powerful charting software and MACD. Amibroker can program to scan the stocks for buy and sell signals.
These are script generated signals. Not all scan results are shown here. The MACD signal should use with price action. Users must understand what MACD and price action are all about before using them. If necessary you should attend a course to learn more on Technical Analysis (TA) and Moving Average Convergence Divergence, MACD.
Once again, the website does not guarantee any results or investment return based on the information and instruction you have read here. It should be used as learning aids only and if you decide to trade real money, all trading decision should be your own.
2 March, 2019
Welcome to AmiBrokerAcademy.com. We provide US stock analysis for academy learning.
Think!
AT&T Inc Stock Charting
Study AT&T Inc stock chart.
As we said to use additional indicator such as MACD to confirm the bear trend.
See chart, we see the positive divergence. Mean possible trend change. So, the bear trend may change.
Remember, the setup will be true until when it fail.
So, for such case. You have to double careful to monitor the trade and cut lost fast. Or reduce your trade size.
You are responsible for your trade plan and your execution.
Trade with your eyes open.
Moses Stock Observation
AmiBrokerAcademy.com
Disclaimer
The above result is for illustration purpose. It is not meant to be used for buy or sell decision. We do not recommend any particular stocks. If particular stocks of such are mentioned, they are meant as demonstration of Amibroker as a powerful charting software and MACD. Amibroker can program to scan the stocks for buy and sell signals.
These are script generated signals. Not all scan results are shown here. The MACD signal should use with price action. Users must understand what MACD and price action are all about before using them. If necessary you should attend a course to learn more on Technical Analysis (TA) and Moving Average Convergence Divergence, MACD.
Once again, the website does not guarantee any results or investment return based on the information and instruction you have read here. It should be used as learning aids only and if you decide to trade real money, all trading decision should be your own.