January 24, 2018
Hong Kong Stock Analysis
Powerful Chart Software – AmiBroker
The following chart is produced using AmiBroker charting software. It is a powerful chart software. You plot the stocks you are interested all in one chart, as long as you still could read them. See chart below. Thereafter slowly climb up, step by step.
0700.HK Tencent Holdings 腾讯控股 Year High Low From 2010
We study Tencent Holdings 腾讯 touch 440 last year (2017), this year the stock price try to breakout 480, maybe another few days, or few weeks, or maybe a few months.
2017 is the best year, it easy to spot from the boxes.
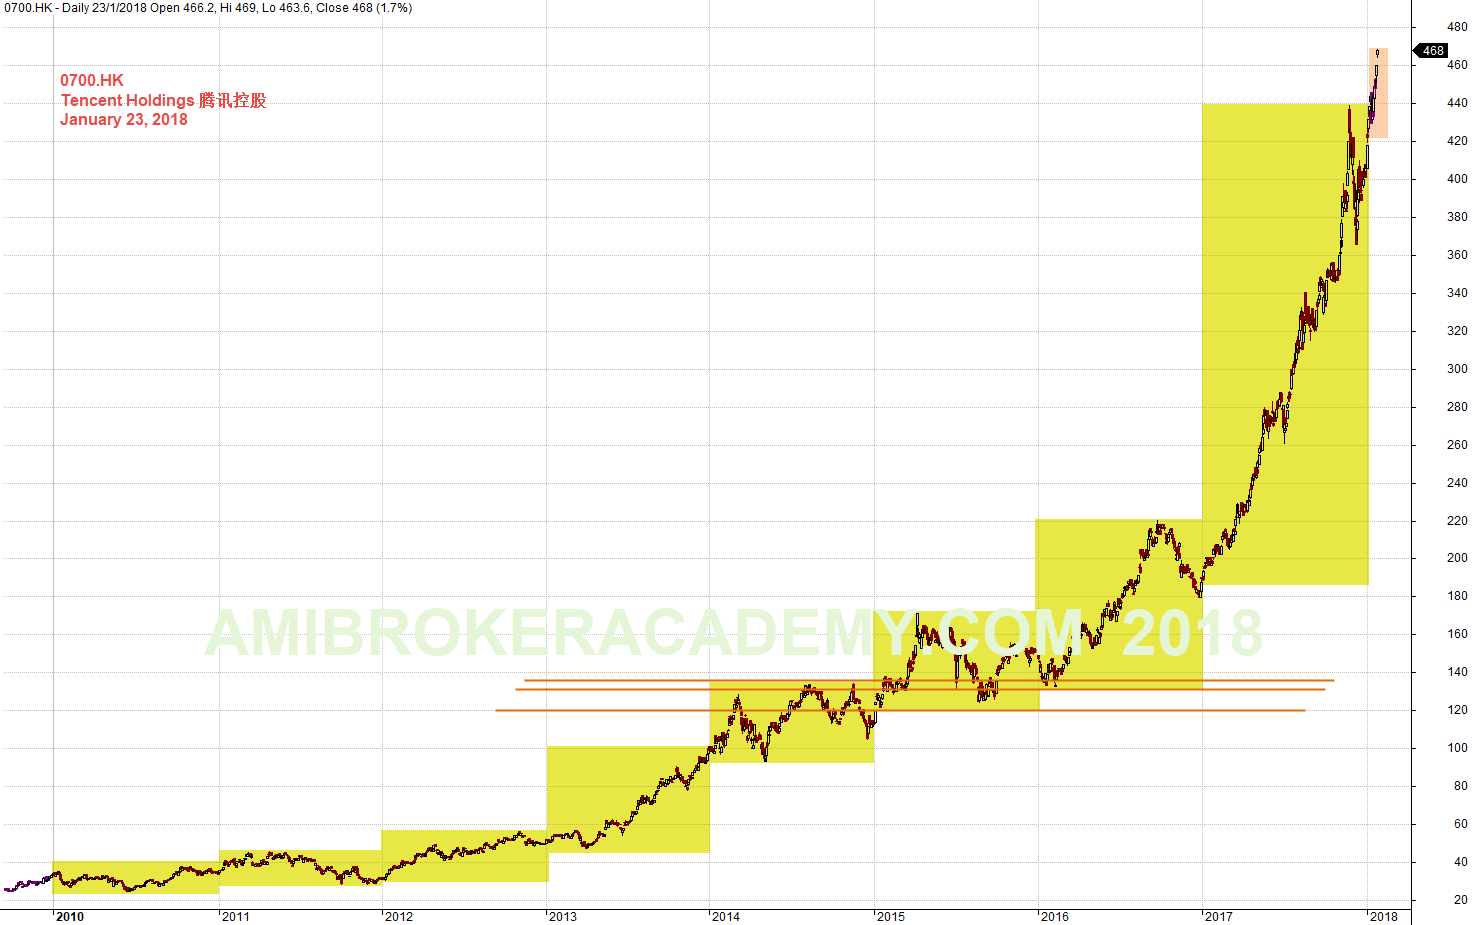
January 23, 2018 Tencent Holdings 腾讯控股 Year High Low From 2010
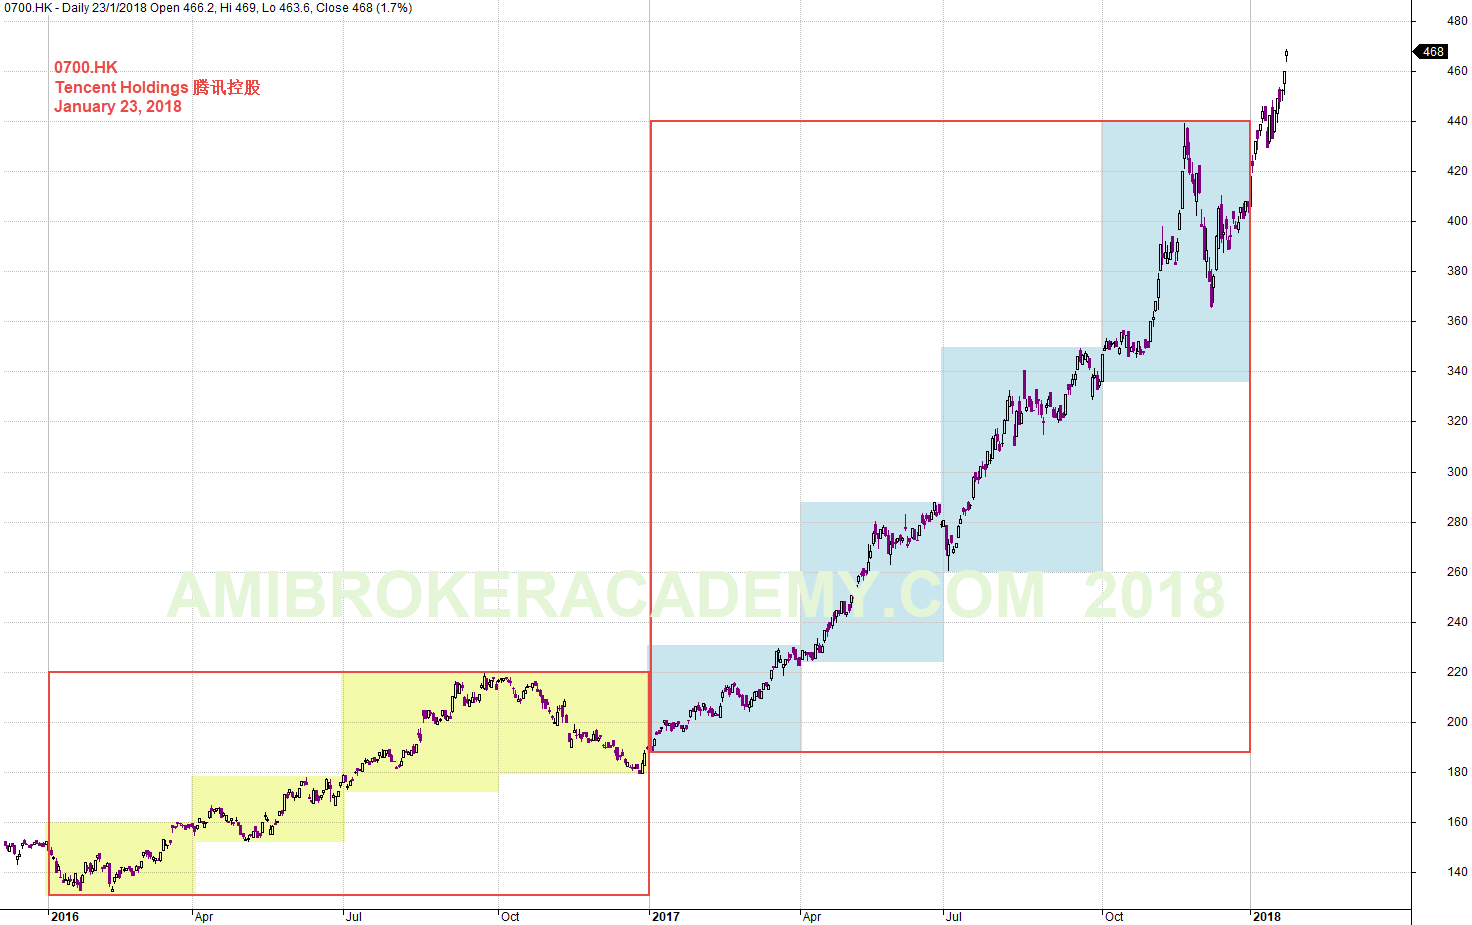
0700.HK Tencent Holdings 腾讯控股 Quarter and Year High Low From 2016
See chart, the last two quarter of 2016 the resistance was strong forced the stock price to retrace downward. After the the price action breakout in 2017, the price just follow the momentum and swing all the way up.
Moses
AmiBrokerAcademy.com
Disclaimer
The above result is for illustration purpose. It is not meant to be used for buy or sell decision. We do not recommend any particular stocks. If particular stocks of such are mentioned, they are meant as demonstration of Amibroker as a powerful charting software and MACD. Amibroker can program to scan the stocks for buy and sell signals.
These are script generated signals. Not all scan results are shown here. The MACD signal should use with price action. Users must understand what MACD and price action are all about before using them. If necessary you should attend a course to learn more on Technical Analysis (TA) and Moving Average Convergence Divergence, MACD.
Once again, the website does not guarantee any results or investment return based on the information and instruction you have read here. It should be used as learning aids only and if you decide to trade real money, all trading decision should be your own.