July 7, 2018
Thanks for visiting the site.
Since now is a start of July, the half year mark for 2018. So, we did a half year performance analysis for last twelve months. Let’s zoom out and see more the half year performance from 2016. Enjoy your learning.
Moses Stock Stories – Thinking Out Loud
Shanghai Stock Exchange Composite Index and Half Year Performance
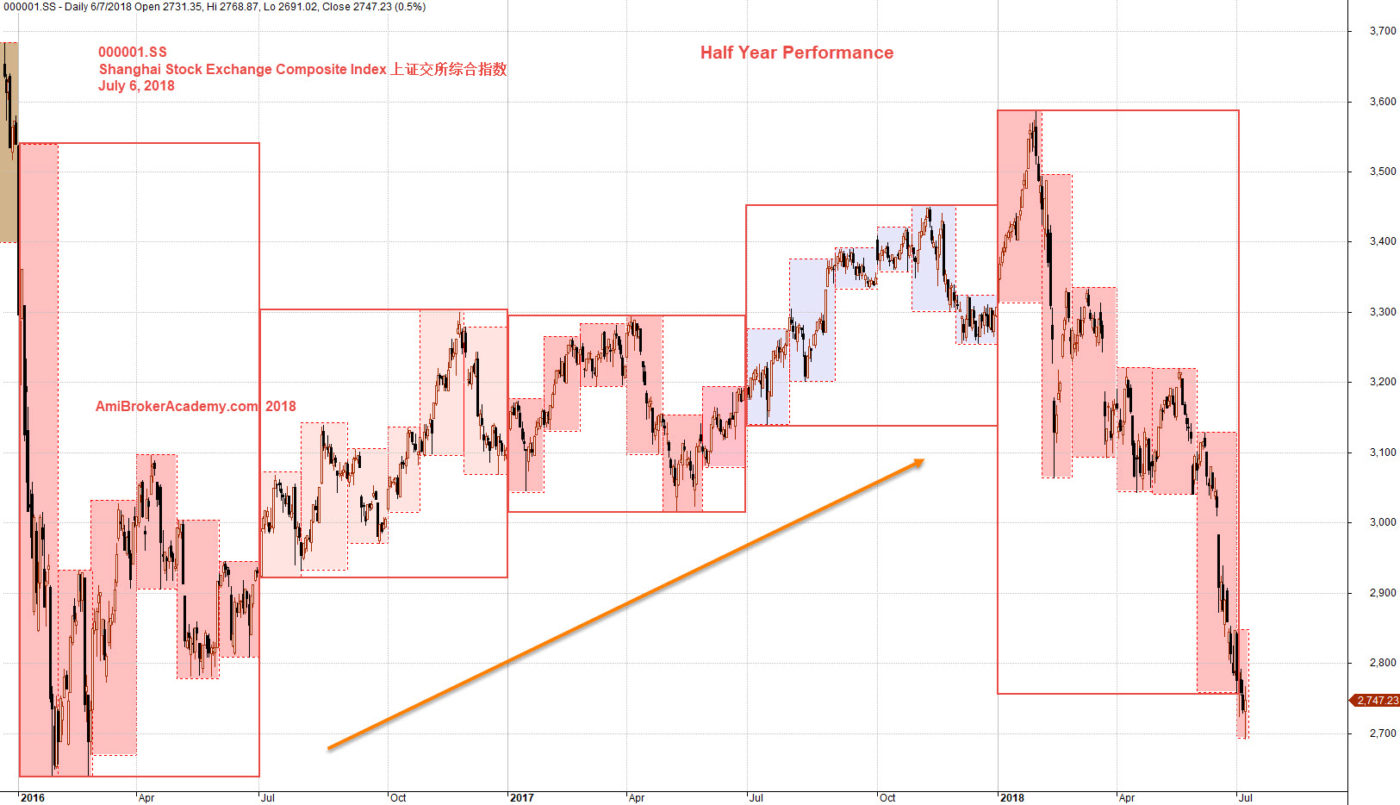
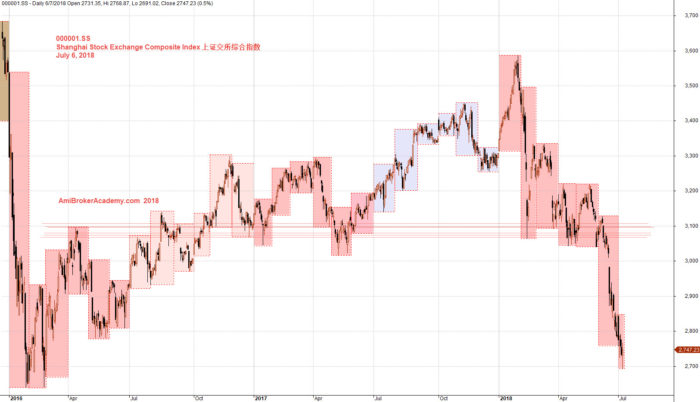
We did a half year analysis on last twelve months 上证交所综合指数 price action. Now we zoom out and look at the six months performance from 2016. Picture worth a thousand words, see chart.
With the interference of the US trade tariff policy. Stock market is one of the major casualty. The SSEC Index was on a bullish trend from 2016. The index has moved south. The fall is continue. Only until the market regain the confidence, otherwise the fall may continue.
To catch the falling knife, wait. Wait for bullish pattern. Manage your risk.
Manage Your Risk!
July 6, 2018 Shanghai Stock Exchange Composite Index and Half Year Performance From 2016
July 6, 2018 Shanghai SE Composite Index and Half Year Performance
上海证券交易所综合股价指数 Shanghai SE Composite Index Charting
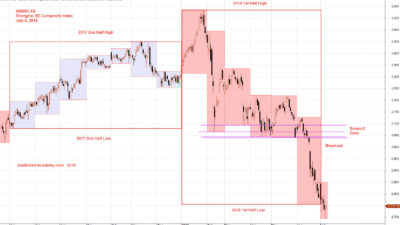
Let’s studied the China 上海证券交易所综合股价指数 Shanghai SE Composite Index, see chart. 上交所指数 Shanghai SE Composite Index overall is bearish when your reference to the last six months. See chart, picture worth a thousand words, price action has breakout from the support zone. Manage your risk.
See the price action on the potential movement. Manage your risk.
Shanghai Stock Exchange Composite Index and Zone
From the chart you can easily identify a great zone. A zone can be resistance or support. The price action has breakout the zone. So, when the price action pullback, the zone will response the pullback. So, watch out for the resistance when pullback. Manage your risk.
July 6, 2018 Shanghai Stock Exchange Composite Index and Zone
Moses
AmiBrokerAcademy.com
Disclaimer
The above result is for illustration purpose. It is not meant to be used for buy or sell decision. We do not recommend any particular stocks. If particular stocks of such are mentioned, they are meant as demonstration of Amibroker as a powerful charting software and MACD. Amibroker can program to scan the stocks for buy and sell signals.
These are script generated signals. Not all scan results are shown here. The MACD signal should use with price action. Users must understand what MACD and price action are all about before using them. If necessary you should attend a course to learn more on Technical Analysis (TA) and Moving Average Convergence Divergence, MACD.
Once again, the website does not guarantee any results or investment return based on the information and instruction you have read here. It should be used as learning aids only and if you decide to trade real money, all trading decision should be your own.