July 6, 2018
Thanks for visiting the site.
We did a analysis last month, and expect the price action continue to fall. See last posting for details.
Moses Stock Stories – Thinking Out Loud
上海证券交易所综合股价指数 Shanghai SE Composite Index Charting
Let’s studied the China 上海证券交易所综合股价指数 Shanghai SE Composite Index, see chart. 上交所指数 Shanghai SE Composite Index overall is bearish when your reference to the last six months. See chart, picture worth a thousand words, price action has breakout from the support zone. Manage your risk.
See the price action on the potential movement. Manage your risk.
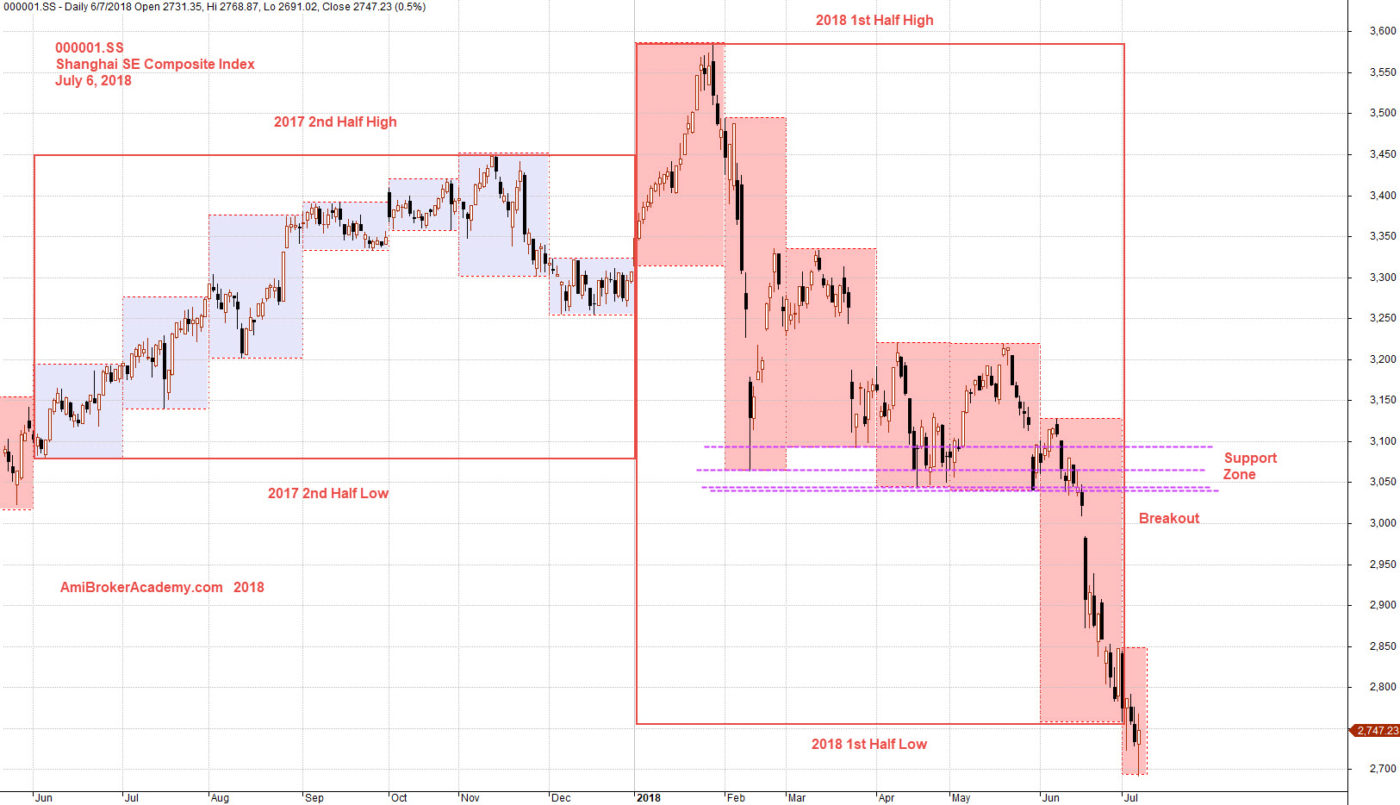
July 6, 2018 Shanghai SE Composite Index and Half Year Performance
Moses
AmiBrokerAcademy.com
Disclaimer
The above result is for illustration purpose. It is not meant to be used for buy or sell decision. We do not recommend any particular stocks. If particular stocks of such are mentioned, they are meant as demonstration of Amibroker as a powerful charting software and MACD. Amibroker can program to scan the stocks for buy and sell signals.
These are script generated signals. Not all scan results are shown here. The MACD signal should use with price action. Users must understand what MACD and price action are all about before using them. If necessary you should attend a course to learn more on Technical Analysis (TA) and Moving Average Convergence Divergence, MACD.
Once again, the website does not guarantee any results or investment return based on the information and instruction you have read here. It should be used as learning aids only and if you decide to trade real money, all trading decision should be your own.