July 30, 2017
You have see market volatility monthly chart. Here we will give you some strategy and our thinking.
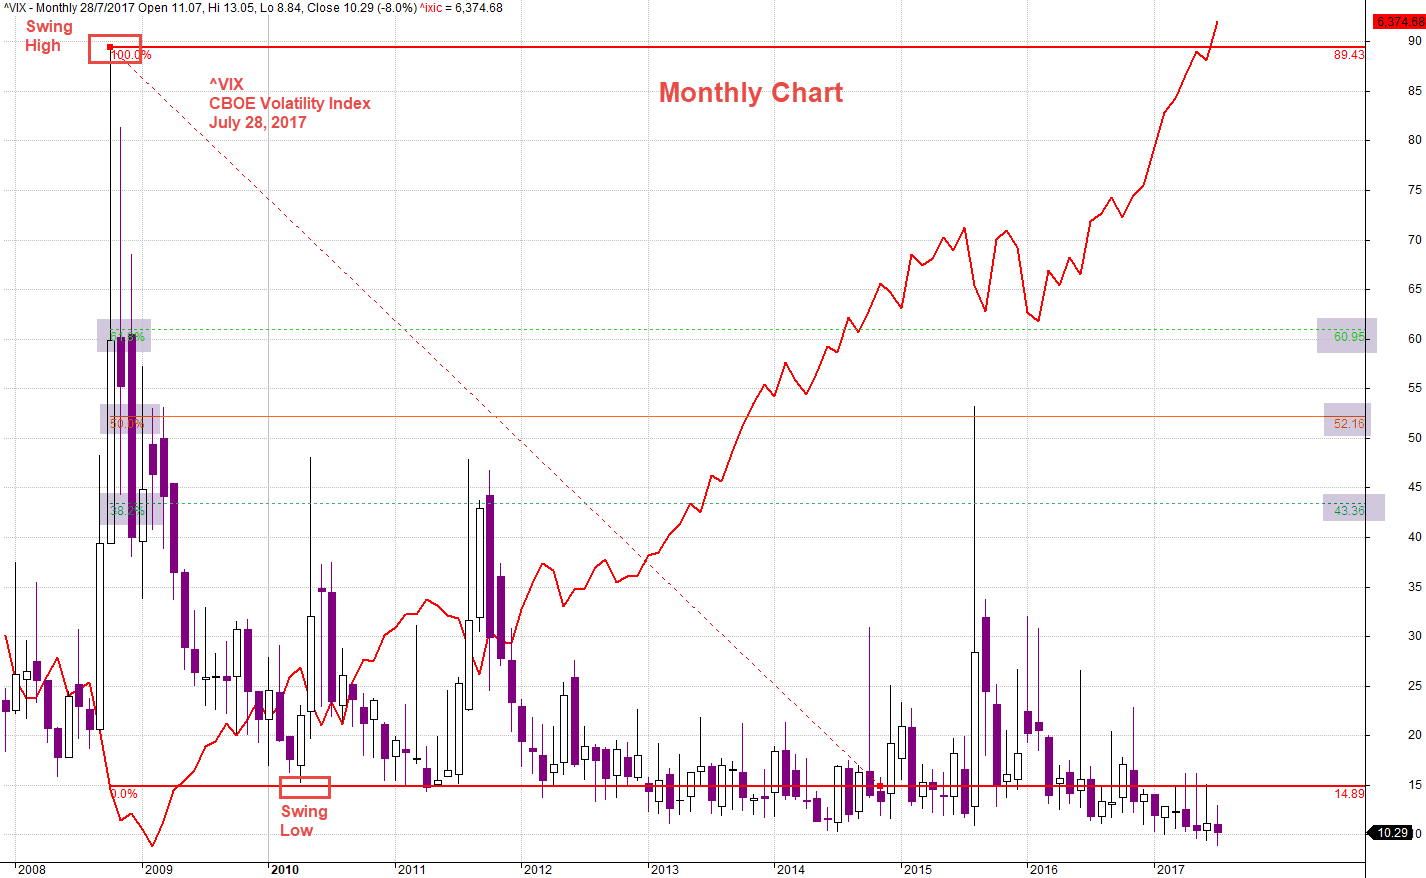
^VIV and NASDAQ Composite and Fibonacci Level
See chart for more, picture worth a thousand words.
When there is a spike in VIX, it means there is a probability of a global sell off. VIX is a forward looking. It is calculated from both calls and puts for the last thirty days, and is a widely used measure of market risk, often referred to as the “investor fear gauge.”
So, sometime it can be worry when market become fearless.
Currently, VIX is making a all time low, and index like NASDAQ Composite is making a all time high.
So, what is next? From a TA (technical analysis) standpoint, the expect the VIX to bounce back up when the market confident get weaken. So, where will the VIX land. See chart for more.
Bounce backup to Fib 38%, 50%, or 61.8% levels. All Fib levels are possible. Do you know? I don’t. So trade with your eyes wide open and don’t think. Can?
July 28, 2017 Volatility Index and Fibonacci Level
CBOE Volatility Index Weekly and Key Fibonacci Levels to Track
So, let’s zoom in, see the chart in weekly chart. See the following levels and MACD signals. These are good level to track.
Enjoy learning here.
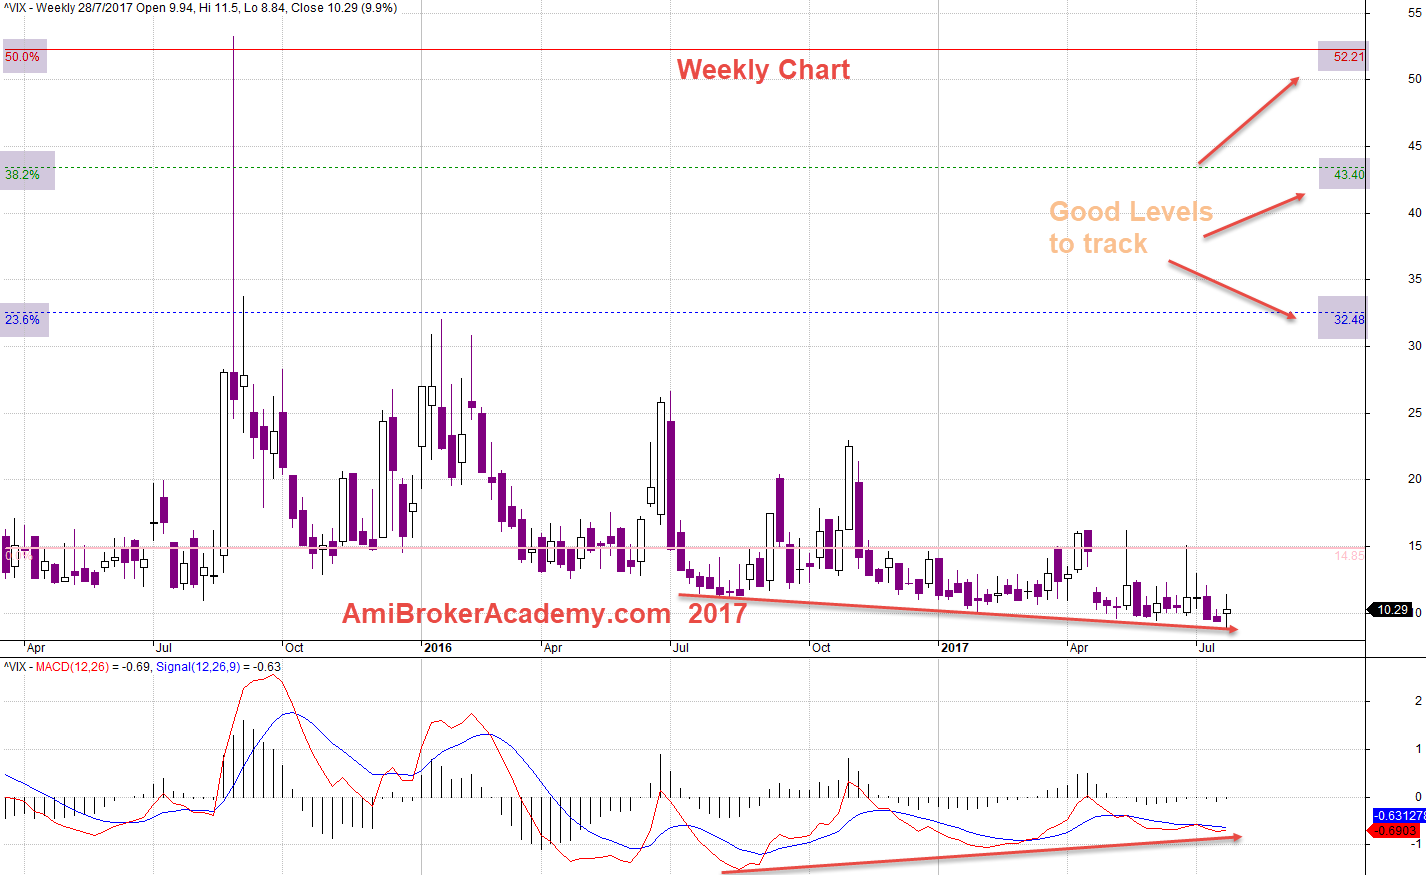
July 28, 2017 Volatility Index Weekly and Good Fibonacci Levels to track
So, What’s Next?
So, what is all these meant to a trader? As a trader we look for buy or sell. So, with the above two charts, okay we understand the market confident or fears, then?
See our next posting for some strategy and thinking. See you.
Moses
AmiBrokerAcademy.com
Disclaimer
The above result is for illustration purpose. It is not meant to be used for buy or sell decision. We do not recommend any particular stocks. If particular stocks of such are mentioned, they are meant as demonstration of Amibroker as a powerful charting software and MACD. Amibroker can program to scan the stocks for buy and sell signals.
These are script generated signals. Not all scan results are shown here. The MACD signal should use with price action. Users must understand what MACD and price action are all about before using them. If necessary you should attend a course to learn more on Technical Analysis (TA) and Moving Average Convergence Divergence, MACD.
Once again, the website does not guarantee any results or investment return based on the information and instruction you have read here. It should be used as learning aids only and if you decide to trade real money, all trading decision should be your own.