May 11, 2017
What is VIX?
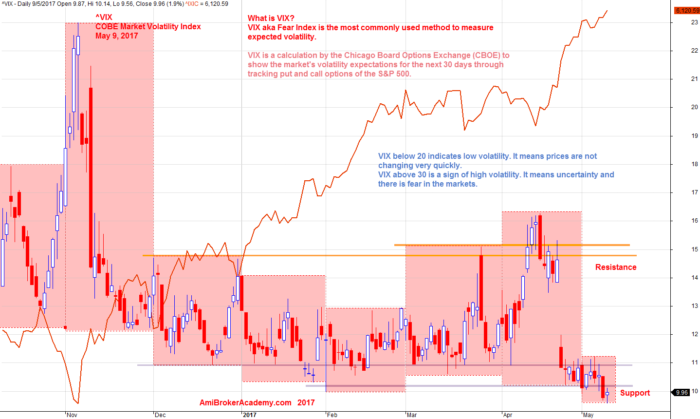
What is VIX?
VIX aka Fear Index is the most commonly used method to measure expected volatility.
VIX is a calculation by the Chicago Board Options Exchange (CBOE) to show the market’s volatility expectations for the next 30 days through tracking put and call options of the S&P 500.
How to Use VIX?
VIX below 20 indicates low volatility. It means prices are not changing very quickly.
VIX above 30 is a sign of high volatility. It means uncertainty and there is fear in the markets.
COBE Market Volatility Index Benchmark NASDAQ Index
May 9, 2017 CBOE Market Volatility Index benchmark NASDAQ Index
The analysis here is intended to be a tutorial only. We look at the chart from different views. We mainly study the popular stocks in US market and Singapore. Hope you can learn something. There is no right no wrong.
Moses Stock Analysis
AmiBrokerAcademy.com
Disclaimer
The above result is for illustration purpose. It is not meant to be used for buy or sell decision. We do not recommend any particular stocks. If particular stocks of such are mentioned, they are meant as demonstration of Amibroker as a powerful charting software and MACD. Amibroker can program to scan the stocks for buy and sell signals.
These are script generated signals. Not all scan results are shown here. The MACD signal should use with price action. Users must understand what MACD and price action are all about before using them. If necessary you should attend a course to learn more on Technical Analysis (TA) and Moving Average Convergence Divergence, MACD.
Once again, the website does not guarantee any results or investment return based on the information and instruction you have read here. It should be used as learning aids only and if you decide to trade real money, all trading decision should be your own.