March 11, 2016
Welcome to AmiBrokerAcademy.com Moses Stock Analysis.
Few More Cents Touch the Peak of Last Twelve Months
Last week, we looked at Golden Agri Resources stock. From the MACD signal we got a cue that price action may change direction. MACD is a leading indicator; it provides you with some hints. Picture worth a thousand words. The market price action did not fail the indicator. Price action continues to drive north.
Picture Worth a Thousand Words
Price action had broken out of a key level; the neckline.
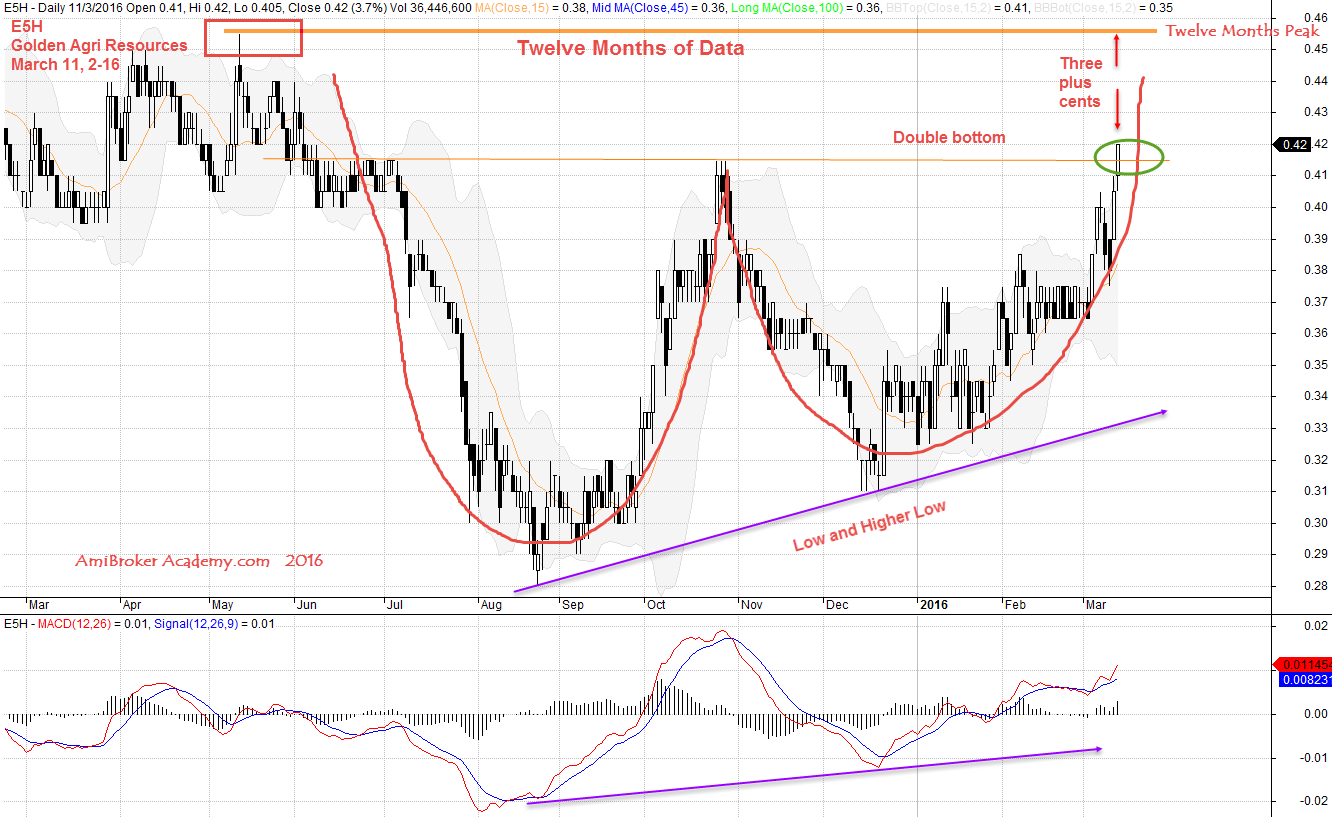
March 11, 2016 Golden Agri Resources Twelve Months Data
Inverted Head and Shoulders and Weekly Data
Price action had broken out from inverted head and shoulders neckline. And also the neckline of double bottom. Another few cents the price action will touch another key level. MACD is a leading indicator, it has also shown the inverted head and shoulders.
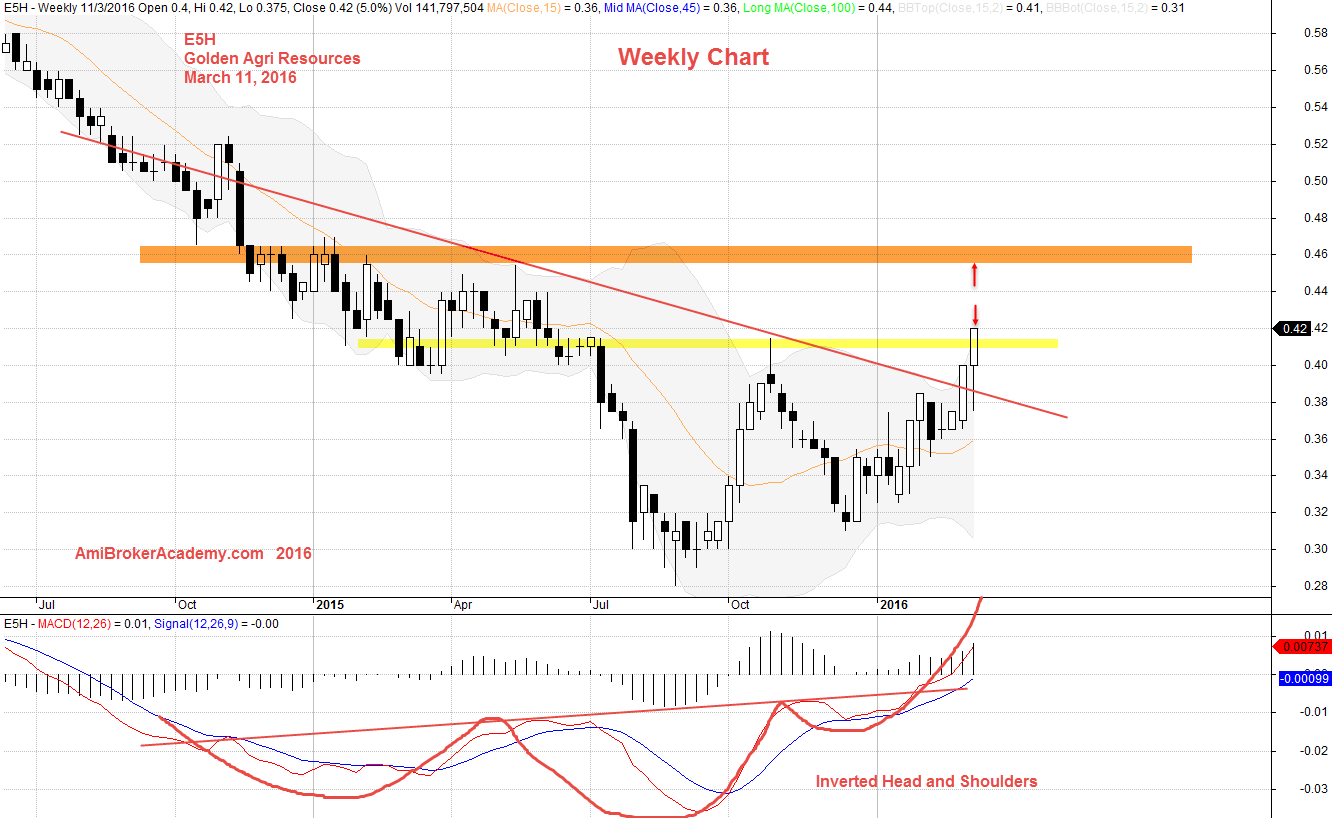
March 11, 2016 Golden Agri Resources Weekly Data
Moses Stocks Analysis and Scan
Disclaimer: All information, data and material contained, presented, or provided on amibrokeracademy.com is for educational purposes only. It is not to be construed or intended as providing trading or legal advice. Decisions you make about your trading or investment are important to you and your family, therefore should be made in consultation with a competent financial advisor or professional. We are not financial advisor and do not claim to be. Any views expressed here-in are not necessarily those held by amibrokeracademy.com. You are responsible for your trade decision and wealth being.