March 11, 2016
Welcome to AmiBrokerAcademy.com.
Divergence – Straits Times Index
Look left and think right. We see ABCD chart pattern, price action forms lower low and MACD signal forms higher low; divergence. Price action broke up the last low.
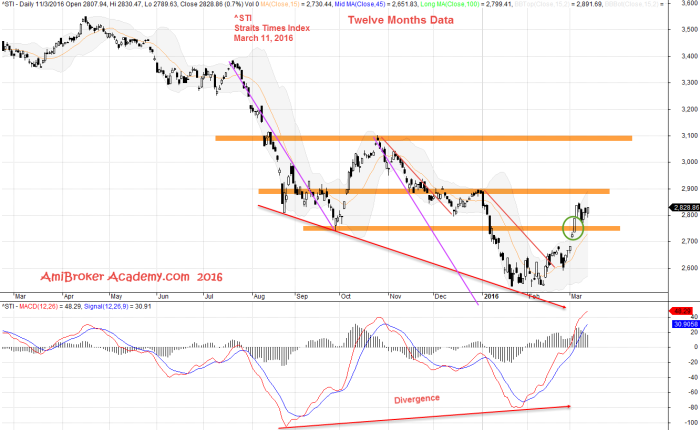
March 11, 2016 Straits Times Index Twelve (12) Months Data
Moses Stocks Analysis and Scan
Disclaimer: All information, data and material contained, presented, or provided on amibrokeracademy.com is for educational purposes only. It is not to be construed or intended as providing trading or legal advice. Decisions you make about your trading or investment are important to you and your family, therefore should be made in consultation with a competent financial advisor or professional. We are not financial advisor and do not claim to be. Any views expressed here-in are not necessarily those held by amibrokeracademy.com. You are responsible for your trade decision and wealth being.