January 31, 2018
Stocks Drop the Most Since August
Wow, Stocks drop the most since August, Dow loses 362 points, reported by https://www.cnbc.com/ see the link below.
https://www.cnbc.com/2018/01/30/us-stock-futures-dow-data-earnings-and-politics-on-the-agenda.html
US Stock Analysis
^DJI Dow Jones Industrial Average Index Chart
See chart, the Dow has a big pullback, a most single day pullback.
Manage your risk!
Powerful Chart Software – AmiBroker
The following chart is produced using AmiBroker charting software. It is a powerful chart software. You plot the stocks you are interested all in one chart, as long as you still could read them. See chart below.
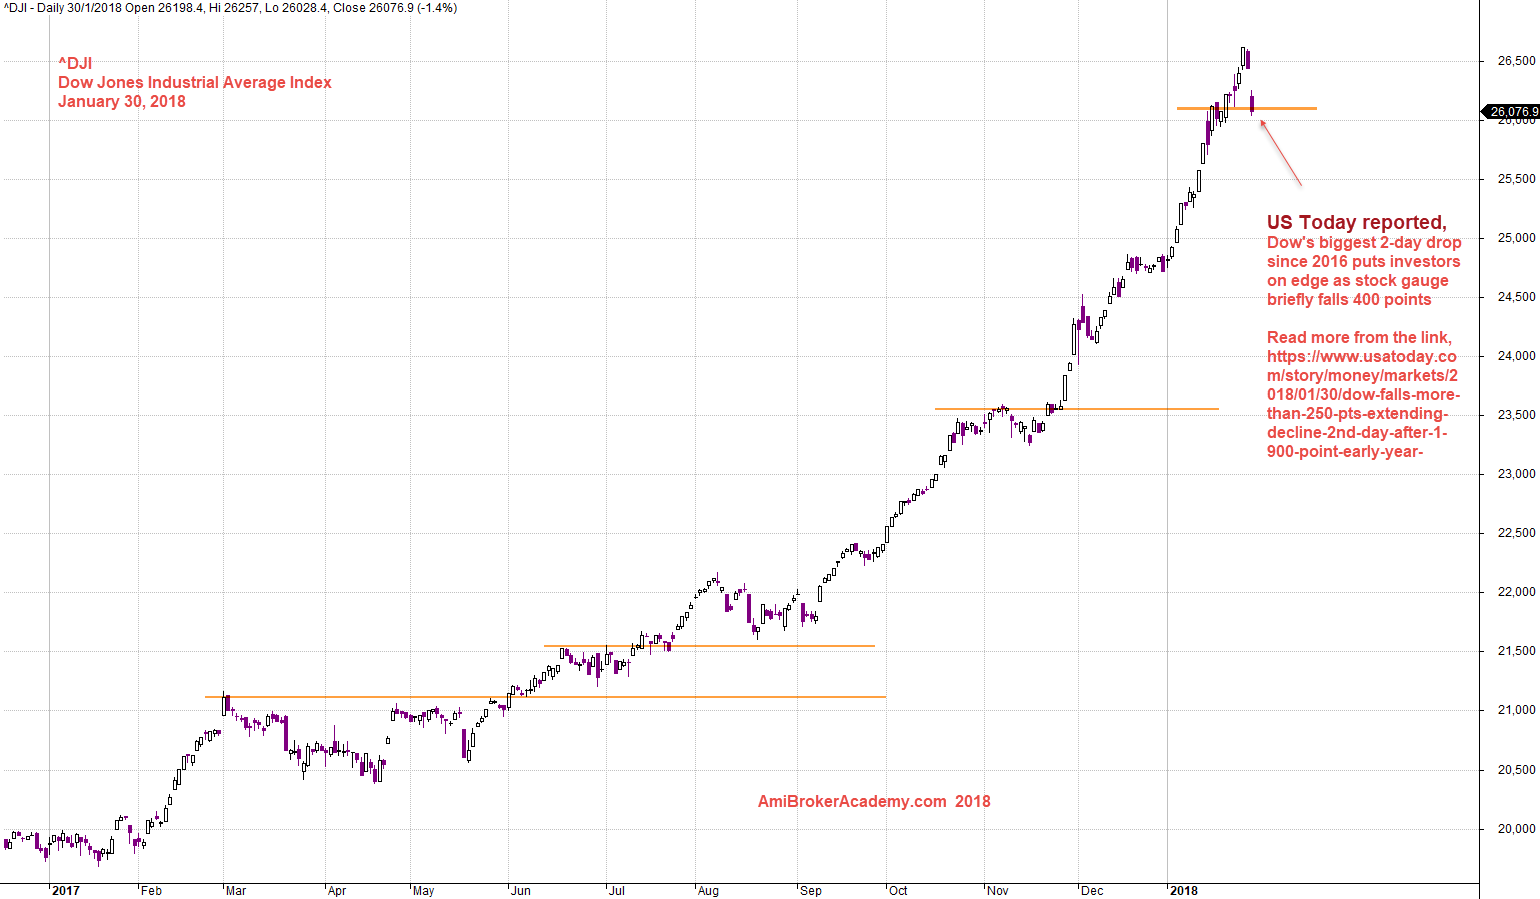
January 30, 2018 Dow Jones Industrial Average Charting – a Most Single Day Drop
Moses
AmiBrokerAcademy.com
Disclaimer
The above result is for illustration purpose. It is not meant to be used for buy or sell decision. We do not recommend any particular stocks. If particular stocks of such are mentioned, they are meant as demonstration of Amibroker as a powerful charting software and MACD. Amibroker can program to scan the stocks for buy and sell signals.
These are script generated signals. Not all scan results are shown here. The MACD signal should use with price action. Users must understand what MACD and price action are all about before using them. If necessary you should attend a course to learn more on Technical Analysis (TA) and Moving Average Convergence Divergence, MACD.
Once again, the website does not guarantee any results or investment return based on the information and instruction you have read here. It should be used as learning aids only and if you decide to trade real money, all trading decision should be your own.