Noble Group Limited, N21
Noble was founded in 1987. The head quarter is in Hong Kong. It is an investment holding company. The company provides supply chain management services for agricultural, industrial, and energy products. It operates in the Peoples Republic of China, Hong Kong, India, Australia, Asia, North America, South America, Africa, and Europe. It has a wide range of products and services. For example, the agricultural products include such as cocoa, coffee, cotton, fertilizers, grains and oilseeds, and sugar. The oil products include such as natural gas liquids, bio fuels, and fuel oil. Plus many more products and services.
Stock Analysis
The 52 weeks rang between the prices of $1.06 to $2.40. After June 10, 2011 N21 price started to break below $2, although it was retested at July 4 again try to break above $2 but fail. The price has fallen lower since then.
The prices keep falling to form the lower bottom, from August 22. The prices push up again after each fall, but prices had retested at $1.63 and $1.66. The selling pressure was too great and pushed the price lower. The support has turned resistance at the zone 1.97 and 2.40. The price now bouncing at this zone.
The price could get resisted and fall lower first before bounced up, or the price could break out of the zon then pull back to retest the zone; turn resistance to become support before fly higher.
MACD histogram is above zero line; for short-term the price potentially has strength to break up. However when over supplier will drive the price lower. Currently, except 20 days EMA looks flat, the rest of 50 days, 100 days and 200 days EMA are pointing down. The price is now below all EMAs.
Short Term
Short term the price may move higher however it is under a lot of resistance. Trade with extreme caution. See the support and resistance on the daily chart.
Noble Group Daily Chart Drawn Using AmiBroker Charting Software. Market closed 8 December, 2011
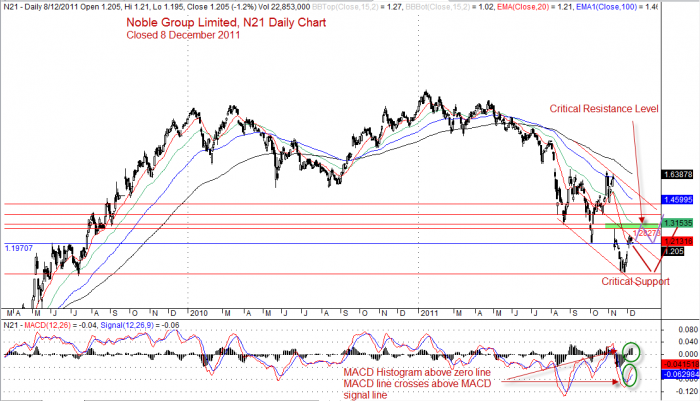
Noble Group Limited, N21 Daily Chart
Disclaimer
The above result is for education purpose. It is not meant to be used for buy or sell decision. We do not recommend any particular stocks. If particular stock of such is mentioned, they are meant as demonstration of Amibroker as a powerful charting software, Technical Analysis such as MACD, Support and Resistance, and Moving Averages.
Once again, the website does not guarantee any results or investment return based on the information and instruction you have read here.
Leave a Reply
You must be logged in to post a comment.