Daily Singapore stocks market scan, using MACD Scanner, MACD scanner has picked 18 stocks at December 9, 2011 on market closed that passed the scanning criteria. The criteria only consider volume exceeding 100K and price closed above $1. Out of 18 stocks picked only 2 stocks were bullish, and the rest of 16 stocks were bearish. Many of the traders and investors were harry to take profit.
The following are the 18 Stocks Pick from MACD Scanner
| Company | Type | Close | Vol.(K) | Screening Result |
| GLOBAL LOGISTIC PROP LIMITED | bearish |
1.72 |
8459 |
MACD Cross-Down ZeroLine |
| KEPPEL LAND LIMITED | bearish |
2.35 |
7984 |
MACD Cross-Down Signal |
| SUNTEC REAL ESTATE INV TRUST | bearish |
1.105 |
6552 |
MACD Cross-Down Signal |
| DBS GROUP HOLDINGS LTD | bearish |
12.08 |
6440 |
MACD Cross-Down Signal |
| CAPITACOMMERCIAL TRUST | bearish |
1.05 |
6361 |
MACD Cross-Down Signal |
| OVERSEA-CHINESE BANKING CORP | bearish |
7.96 |
5856 |
MACD Cross-Down ZeroLine |
| CAPITAMALLS ASIA LIMITED | bearish |
1.22 |
5110 |
MACD Cross-Down Signal |
| COMFORTDELGRO CORPORATION LTD | bearish |
1.42 |
4675 |
MACD-H -ve Divergence |
| KEPPEL CORPORATION LIMITED | bearish |
9.2 |
3434 |
MACD Cross-Down Signal |
| SINGAPORE TECH ENGINEERING LTD | bearish |
2.73 |
2904 |
MACD Cross-Down ZeroLine |
| FRASER AND NEAVE LIMITED | bearish |
5.93 |
2495 |
MACD Cross-Down ZeroLine |
| BIOSENSORS INT’L GROUP LTD. | bearish |
1.355 |
2109 |
MACD Cross-Down Signal |
| DBXT MSCI RUSSIA CAP 25 ETF 10 | bearish |
2.76 |
658 |
MACD Cross-Down Signal |
| ASCOTT RESIDENCE TRUST | bullish |
1.01 |
436 |
MACD Cross-Up ZeroLine |
| ARA ASSET MANAGEMENT LIMITED | bullish |
1.155 |
398 |
MACD Cross-Up Signal |
| UOB-KAY HIAN HOLDINGS LIMITED | bearish |
1.535 |
211 |
MACD Cross-Down Signal |
| SP AUSNET | bearish |
1.225 |
183 |
MACD Cross-Down ZeroLine |
| STI ETF | bearish |
2.77 |
164 |
MACD Cross-Down ZeroLine |
Straits Times Index, STI Daily Chart with Dow Jones Index, DJI
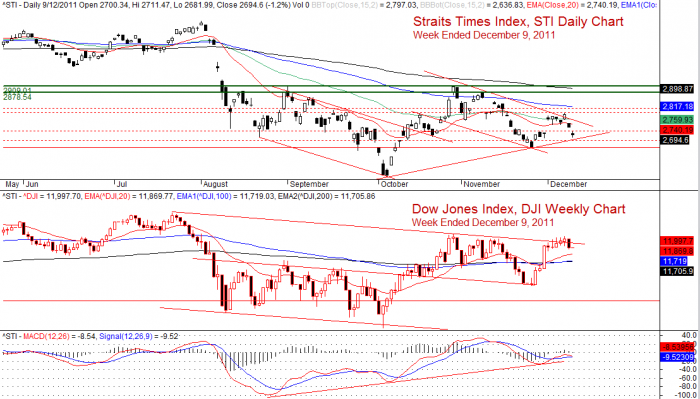
Straits Times Index, STI and Dow Jones Index, DJI Daily Chart
Daily Straits Times Index
The Straits Times stocks market benchmark, Straits Times Index, STI is closed another 33.71 points lower than previous day closed.
O (open) = 2700.34 points
C (close) = 2694.60 points
H (high) = 2711.47 points
L (low) = 2681.99 points
Previous day closed 2728.31 points
Straits Times Index, STI Weekly Chart with Dow Jones Index, DJI
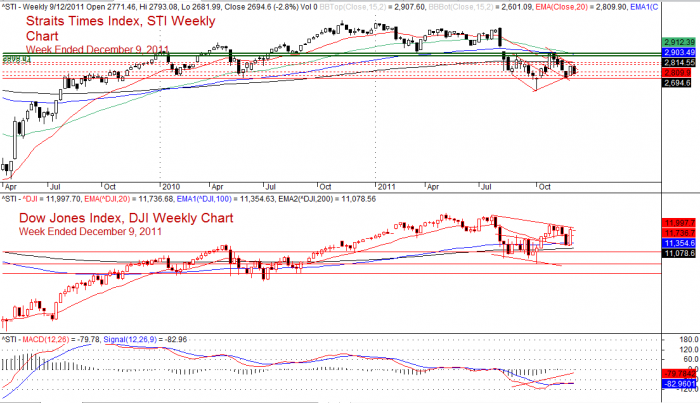
Straits Times Index, STI & Dow Jones Index, DJI Weekly Chart
Weekly Straits Times Index
The whole week STI was down 78.76 points compares to last week closed.
O (open) = 2771.46 points
C (close) = 2694.60 points
H (high) = 2798.08 points
L (low) = 2681.99 points
STI is at the critical support zone this week.
Disclaimer
The above result is for illustration purpose. It is not meant to be used for buy or sell decision. We do not recommend any particular stocks. If particular stocks of such are mentioned, they are meant as demonstration of Amibroker as a powerful charting software and MACD characteristics. Amibroker can program to scan the stocks for buy and sell signals.
These are script generated signals. Not all scan results are shown here. The MACD signal should use with price action. Users must understand what MACD and price action are all about before using them. If necessary you should attend a course to learn more on Technical Analysis (TA) and Moving Average Convergence Divergence, MACD.
Once again, the website does not guarantee any results or investment return based on the information and instruction you have read here.