April 10, 2017
Moses Stock Trading Blog Site – AmiBrokerAcademy.com
Thank you for visiting the amibrokeracademy.com blog site. No one doing analysis like what you read here.
Welcome to Moses’s US Stock Analysis @ AmiBrokerAcademy.com.
I would suggest you study the charts that we posted here in the last few days.
Are You Wise?
Remember, trading is not a get rich fast business like many have advertised. It needs a lot of hard work, good money to manage risk and have patience.
It is always wise to wait for another day to see where the market is going. Imaging professional traders do not like to buy high and sell higher.
Let the market comes back down before you go.
Have fun learning!
^SSE Shanghai Stock Exchange Composite Index Chart and Channel
We always like to see the chart in different view, so we could understand our reading better. In the first glance, the price is testing and retesting the same high.
Price just left the lower level of channel. can the price touch the upper level. I don’t know. However, if the price continue the same price structure, yes, it would reach eventually.
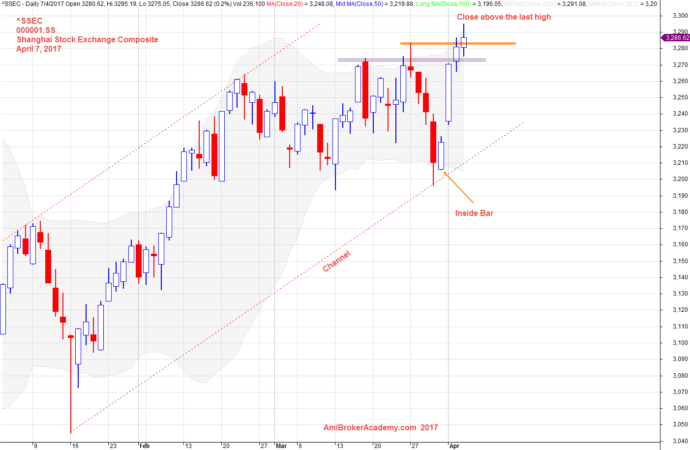
April 7, 2017 Shanghai SE Composite Index and Channel
^SSEC Shanghai Stock Exchange Composite Index Chart and MACD Indicator
Any divergence? The strength is good. MACD crossup signal. See chart for more. Picture worth a thousand words.
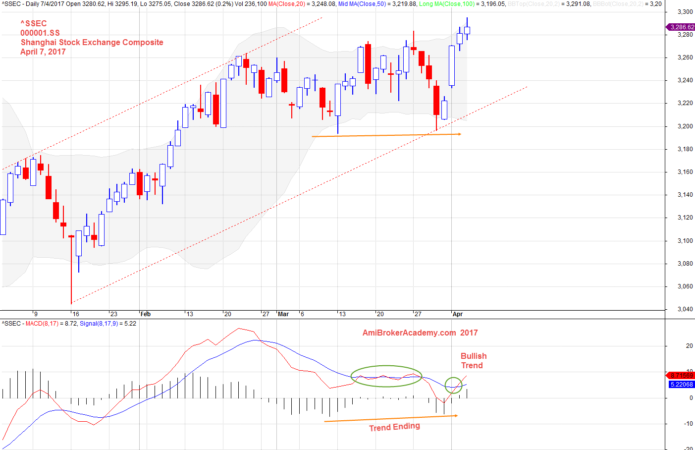
April 7, 2017 Shanghai SE Composite Index and MACD Indicator
^SSEC Shanghai Stock Exchange Composite Index Chart and 34 EMA Wave
Index is above the 34 EMA wave. The index is still in bullish mode.
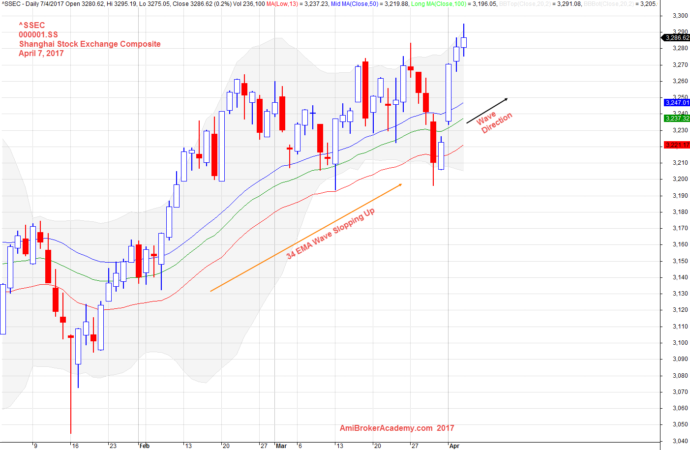
April 7, 2017 SSEC and 34 EMA
Nothing is 100%!
Happy learning.
Moses Stock Analysis
AmiBrokerAcademy.com
Disclaimer
The above result is for illustration purpose. It is not meant to be used for buy or sell decision. We do not recommend any particular stocks. If particular stocks of such are mentioned, they are meant as demonstration of Amibroker as a powerful charting software and MACD. Amibroker can program to scan the stocks for buy and sell signals.
These are script generated signals. Not all scan results are shown here. The MACD signal should use with price action. Users must understand what MACD and price action are all about before using them. If necessary you should attend a course to learn more on Technical Analysis (TA) and Moving Average Convergence Divergence, MACD.
Once again, the website does not guarantee any results or investment return based on the information and instruction you have read here. It should be used as learning aids only and if you decide to trade real money, all trading decision should be your own.
34 EMA Wave is Raghee strategy.