February 10, 2017
Moses Stock Trading Blog Site – AmiBrokerAcademy.com
Thank you for visiting the amibrokeracademy.com blog site. No one like us doing analysis like what you read here.
Welcome to Moses’s US Stock Analysis @ AmiBrokerAcademy.com.
^GSPC S&P 500 and Fibonacci
S&P 500 has a MACD cross up signal and follows a MACD cross down signal. Subsequently the MACD signal trace along. The strength is week, wait one more day before you make a trade, buy or sell trade what you see lah.
S&P 500 has been supported by Fibonacci 61.8% as shown on the chart here.
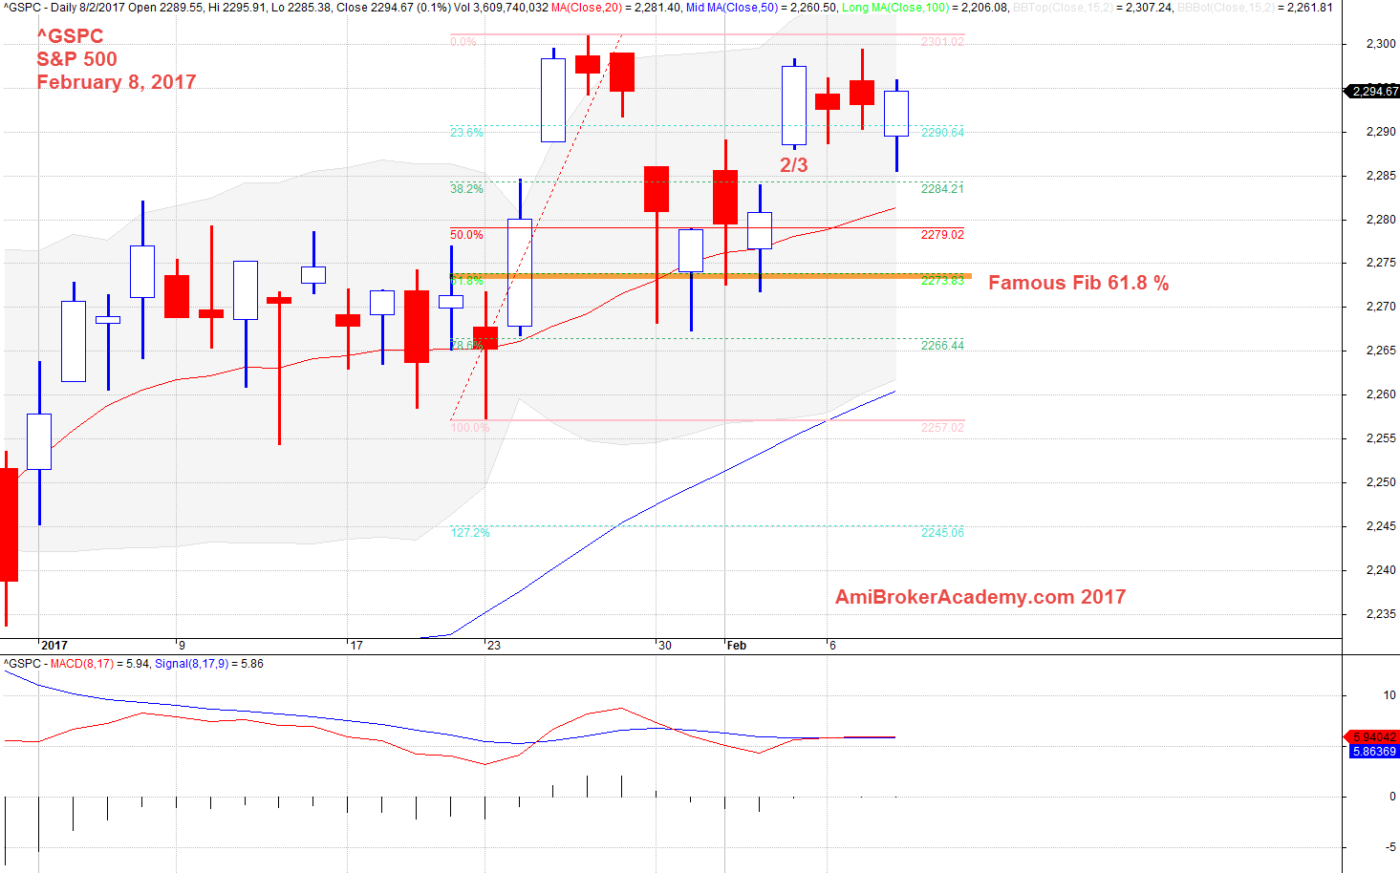
February 8, 2017 S&P 500 and Fibonacci 61.8%
^GSPC S&P 500 and Fibonacci
The tail almost touch the 78%, if you will look at the chart closely the price action actually supported by 61%. So, the key level like 61% is a good level to watch.
So, if the bar does not close below the key level, you will have to think twice to assume the trend is bearish.
Moses
AmiBrokerAcademy.com
Disclaimer
The above result is for illustration purpose. It is not meant to be used for buy or sell decision. We do not recommend any particular stocks. If particular stocks of such are mentioned, they are meant as demonstration of Amibroker as a powerful charting software and MACD. Amibroker can program to scan the stocks for buy and sell signals.
These are script generated signals. Not all scan results are shown here. The MACD signal should use with price action. Users must understand what MACD and price action are all about before using them. If necessary you should attend a course to learn more on Technical Analysis (TA) and Moving Average Convergence Divergence, MACD.
Once again, the website does not guarantee any results or investment return based on the information and instruction you have read here. It should be used as learning aids only and if you decide to trade real money, all trading decision should be your own.