July 24, 2017
^XAU PHLX Gold Silver Index
See chart for more, picture worth a thousand words.
The PHLX Gold Siver price has stopped rally August last year, price pullback and rally again, but the price fail to go higher. The price has continue to form lower high and lower low for the entire second half of the year since August.
The index stop near 72, thereafter the index begin to rally again. However, 97 level seems to be the ceiling to stop the index from going any higher.
The index is currently hover between 80 and 89; sideways.
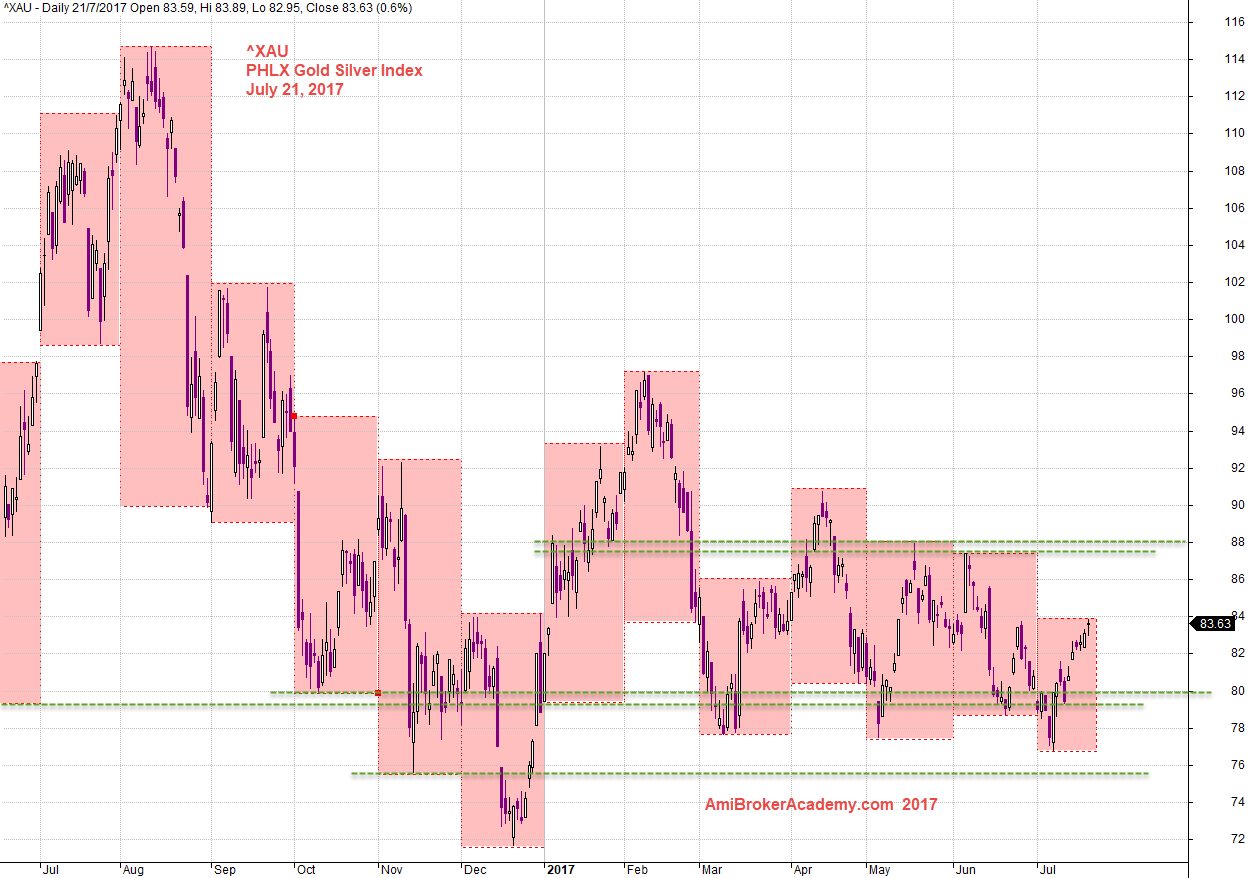
July 21, 2017 PHLX Gold Silver Index and Levels
^XAU PHLX Gold Silver Index and 34 MA Band
After we have study the ^XAU support and resistance, and recognize the trend. We may like to use moving average to see the trend bias. So, let’s add the 34 MA band.
From the 34 MA Band, we see the index above the 34 MA Band at first, follow crossing below the 34 MA Band, then cross up the band again, and fail below the band, and finally the index is below and resisted by the 34 MA band.
Check the 200 MA, the index is current resisted by the 200 MA after its crossed below the 200 MA.
200 MA is currently banding down; bearish? Will see.
The 34 MA band gives you an idea to sell when the index test and resisted by the MA band. Only enter when you have confirmation of bearish candle or trend.
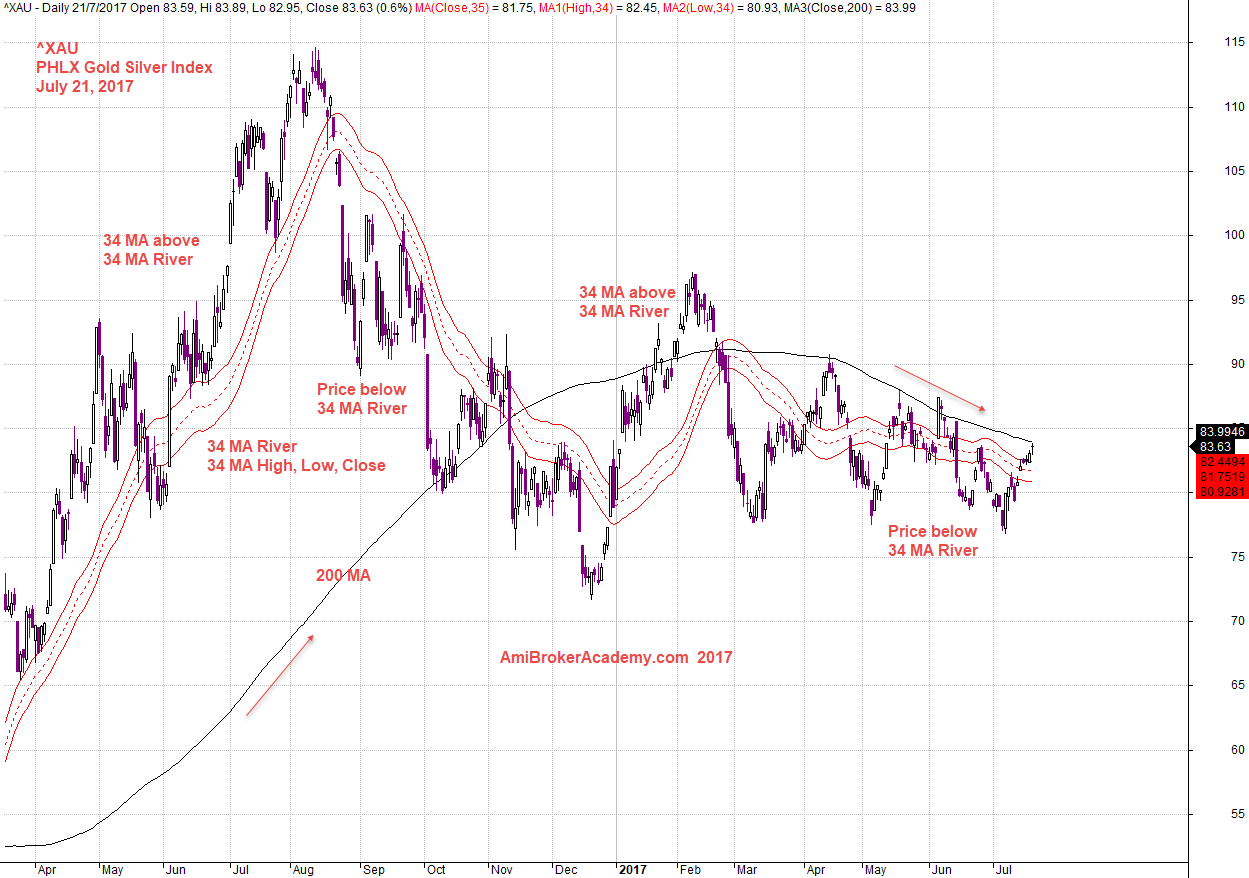
July 21, 2017 PHLX Gold Silver Index and 34 MA Band
^XAU PHLX Gold Silver Index and MACD
After we study the chart using support resistance, moving average, 34 MA band and now see MACD indicator.
What can you get from the chart?
MACD is now close to zeroline, MACD may breakout above zeroline line. So, the trend may end it bearish trend and become bullish. But, before turn bullish, may be the index will go sideways first. Will see.
Remember in our first analysis in the posting, support resistance. We say sideways, if you still remember …
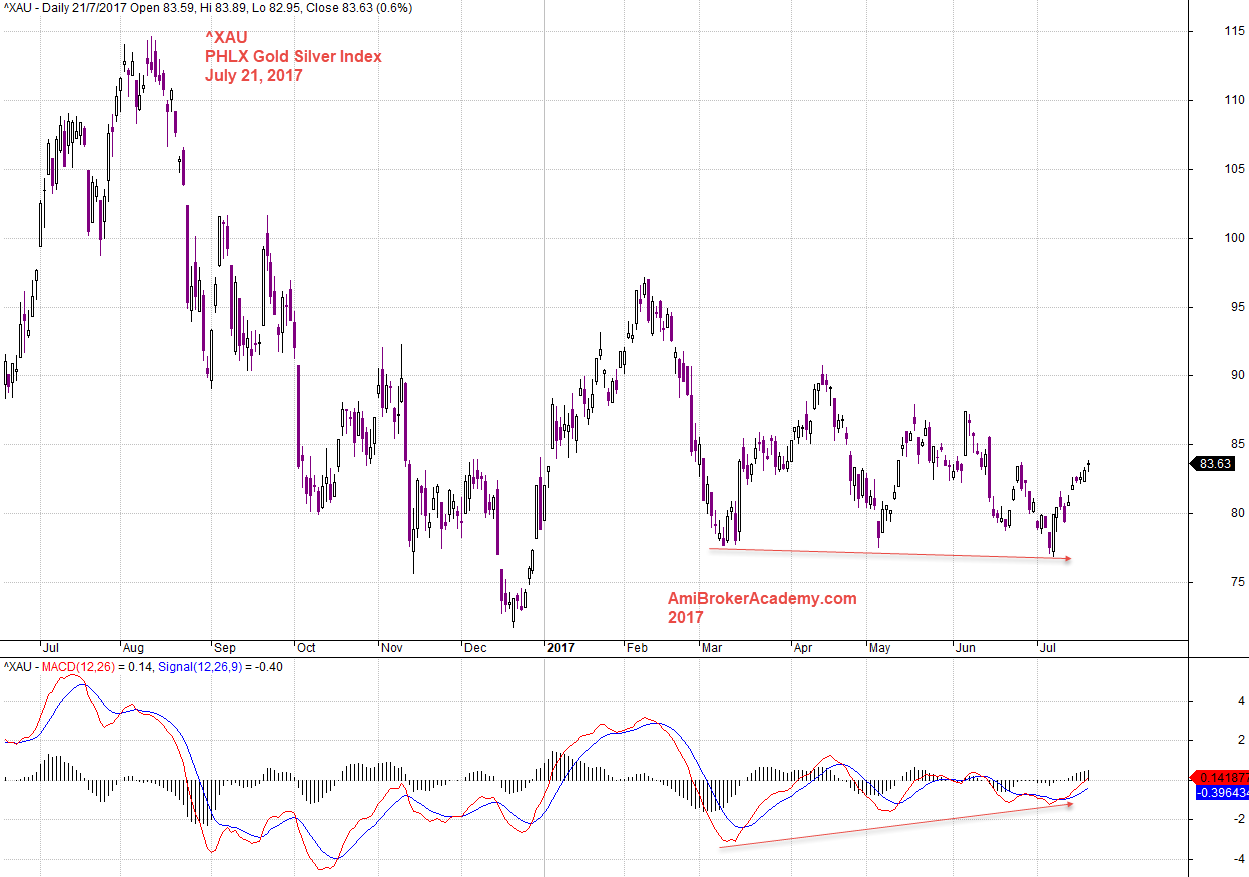
July 21, 2017 PHLX Gold Silver and MACD
Thanks for visit the site here. You could also find free MACD scan here in this site too.
Moses
AmiBrokerAcademy.com
Disclaimer
The above result is for illustration purpose. It is not meant to be used for buy or sell decision. We do not recommend any particular stocks. If particular stocks of such are mentioned, they are meant as demonstration of Amibroker as a powerful charting software and MACD. Amibroker can program to scan the stocks for buy and sell signals.
These are script generated signals. Not all scan results are shown here. The MACD signal should use with price action. Users must understand what MACD and price action are all about before using them. If necessary you should attend a course to learn more on Technical Analysis (TA) and Moving Average Convergence Divergence, MACD.
Once again, the website does not guarantee any results or investment return based on the information and instruction you have read here. It should be used as learning aids only and if you decide to trade real money, all trading decision should be your own.