August 27, 2017
We look at Starbucks stock data since 2014, a bull flag; a short pole but long body. See below chart for some idea. But, but the share price looks sideways. …
We try to understand the price action of the stock, Starbucks.

August 25, 2017 Starbucks Corp Data Since 2014 and Wave Count
Starbucks Corp SBUX Data Since 2014
Picture worth a thousand words, see chart for more.
If we count the waves. we can see impulse wave 1, 3, and 5, we also see the corrective wave 2, 4 and a, b, c.
SBUX Starbucks Corp and Channel
Picture worth a thousand words, see chart for more.
Connecting the low and draw a trendline. Copy and paste the trendline to the peak, we form channel. Price action has breakout below channel. Will these bar become abandon “baby”, if we combine all the candlesticks into one.
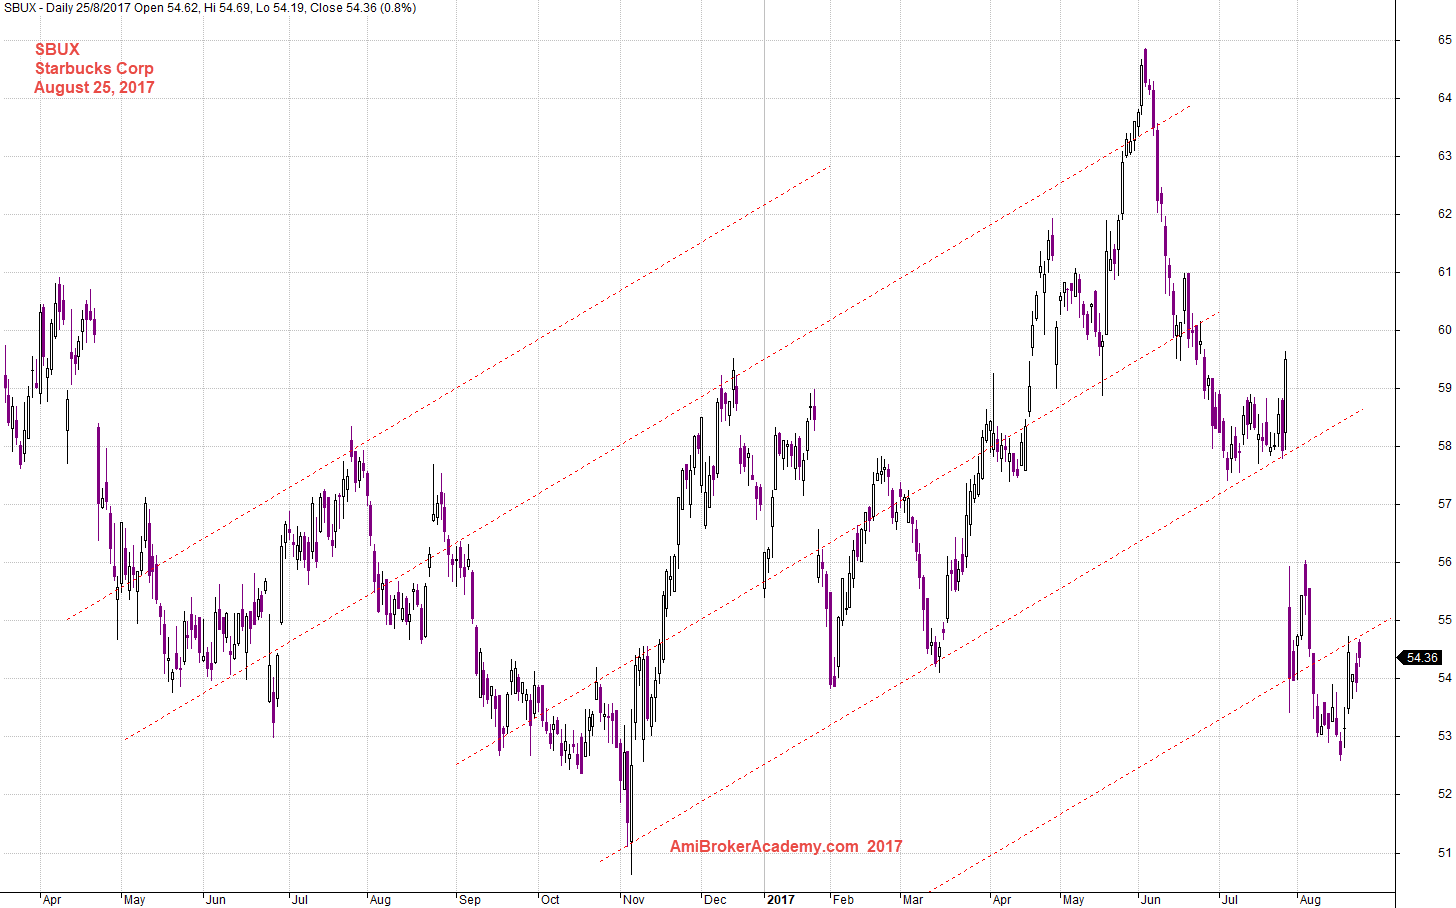
August 25, 2017 Starbucks Corp and Channel
SBUX Starbucks Corp and Support Resistance
Picture worth a thousand words. Can you see resistance? Can you see support? Resistance is like floor, to stop price from falling further down. Support is like ceiling, prevent the price from going further north.
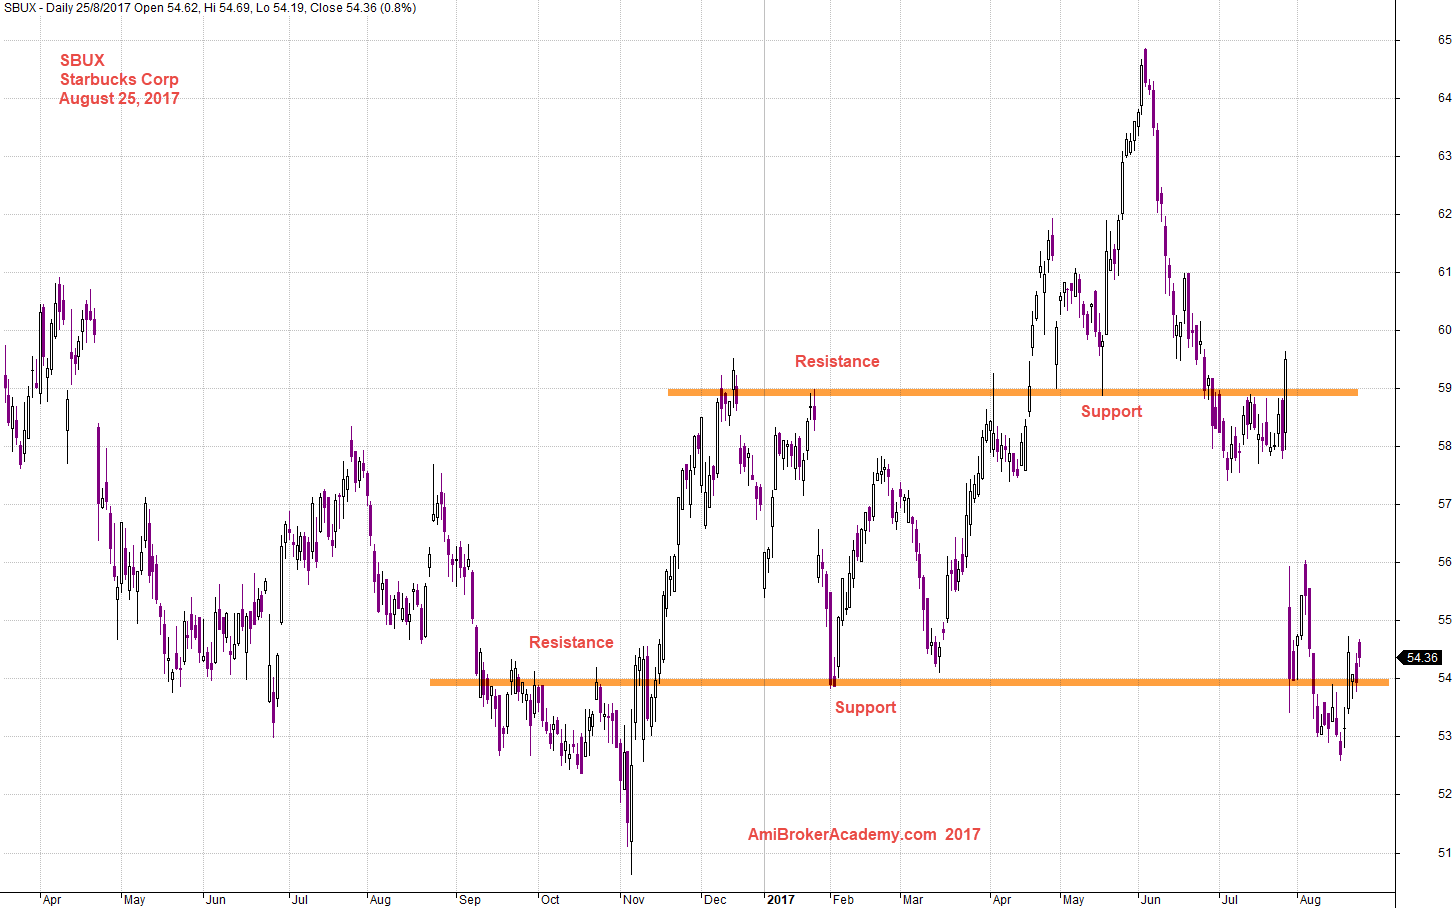
August 25, 2017 Starbacks Corp and Support Resistance
SBUX Starbucks Corp and 34 MA Band
Picture worth a thousand words. Price action crosses up and down of MA, 34 MA Band. Finally, the price crosses down and get resisted by MA band.
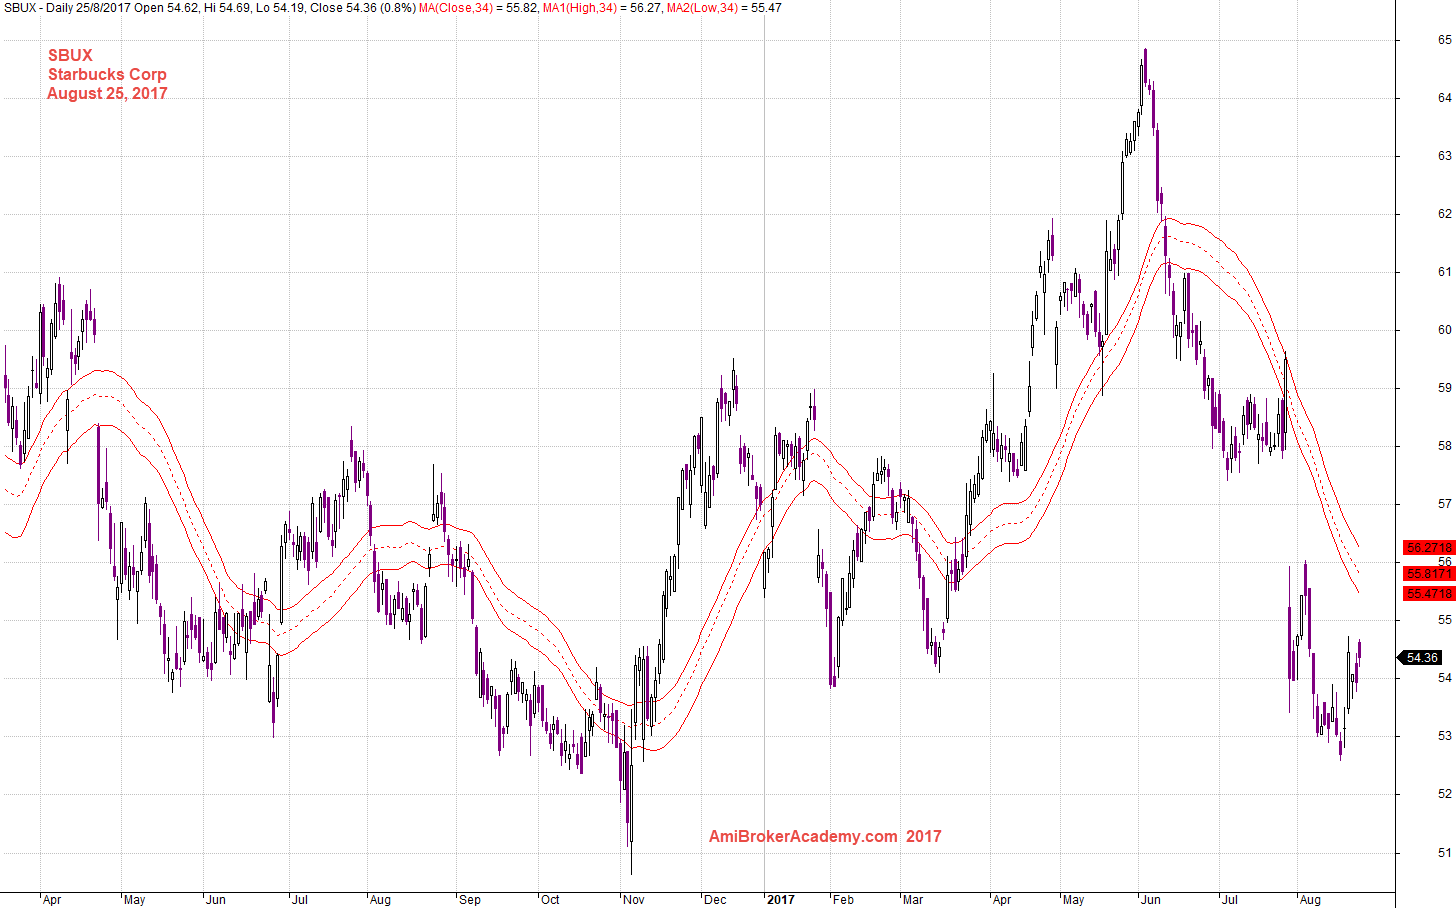
August 25, 2017 Starbucks Corp and 34 MA Band
SBUX Starbucks Corp and Channel
Picture worth a thousand words, see chart. The channel like a bull flag. But the flag pole is short. The price action fail and retest the low the low again.
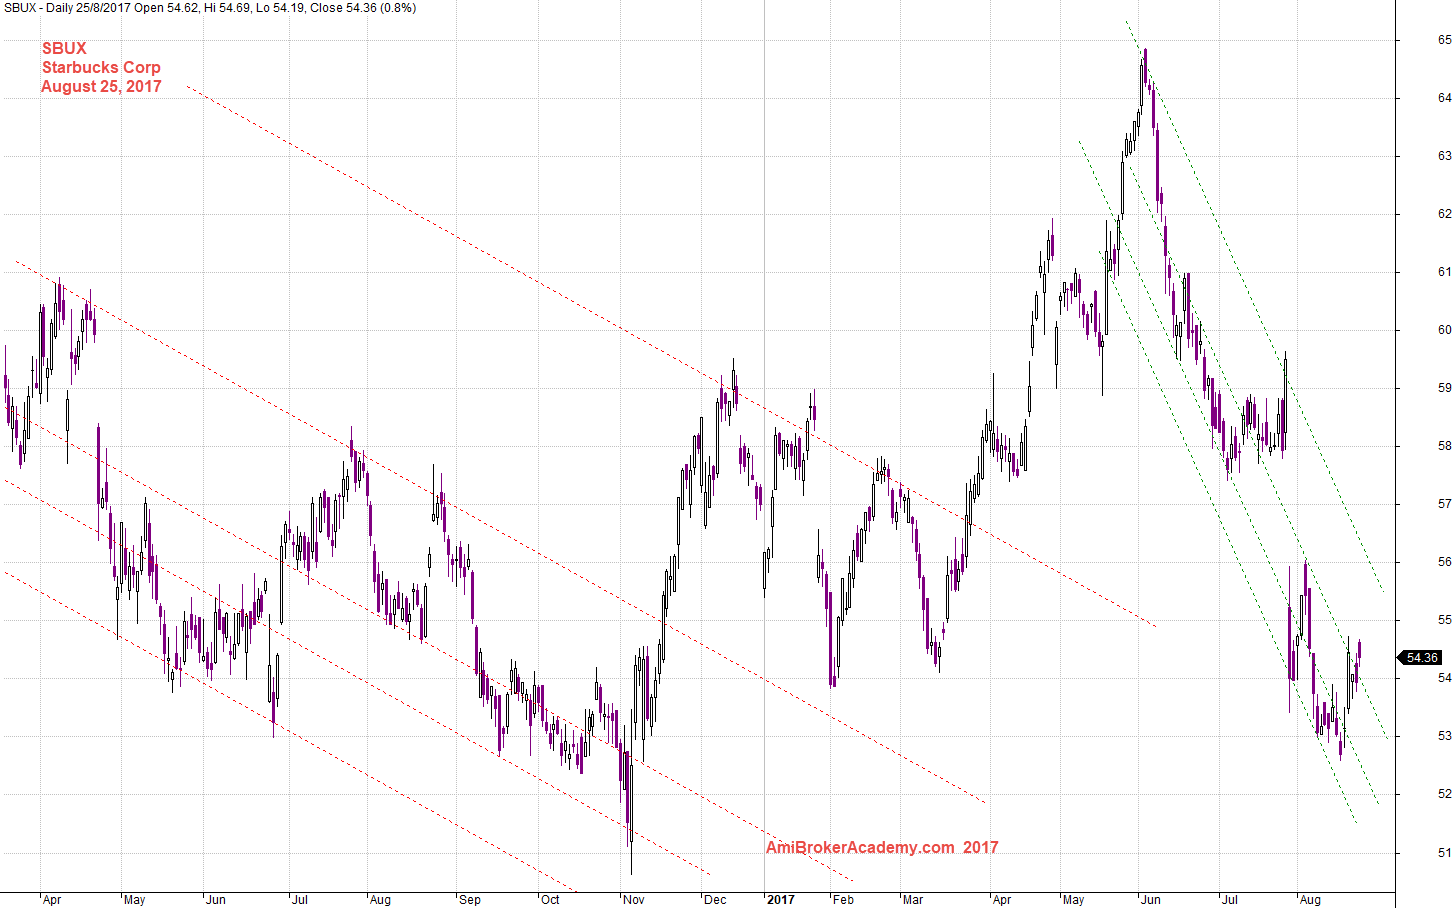
August 25, 2017 Starbucks Corp and Channel in a different perspective
Have fun! Enjoy learning.
Thanks for visit the site here. You could also find free MACD scan here in this site too.
Moses
AmiBrokerAcademy.com
Disclaimer
The above result is for illustration purpose. It is not meant to be used for buy or sell decision. We do not recommend any particular stocks. If particular stocks of such are mentioned, they are meant as demonstration of Amibroker as a powerful charting software and MACD. Amibroker can program to scan the stocks for buy and sell signals.
These are script generated signals. Not all scan results are shown here. The MACD signal should use with price action. Users must understand what MACD and price action are all about before using them. If necessary you should attend a course to learn more on Technical Analysis (TA) and Moving Average Convergence Divergence, MACD.
Once again, the website does not guarantee any results or investment return based on the information and instruction you have read here. It should be used as learning aids only and if you decide to trade real money, all trading decision should be your own.