August 27, 2017
Like to drink coffee, are you also like the stock?
Starbucks Corp SBUX Data Since 2014
Picture worth a thousand words, see chart for more.
If we count the waves. we can see impulse wave 1, 3, and 5, we also see the corrective wave 2, 4 and a, b, c.
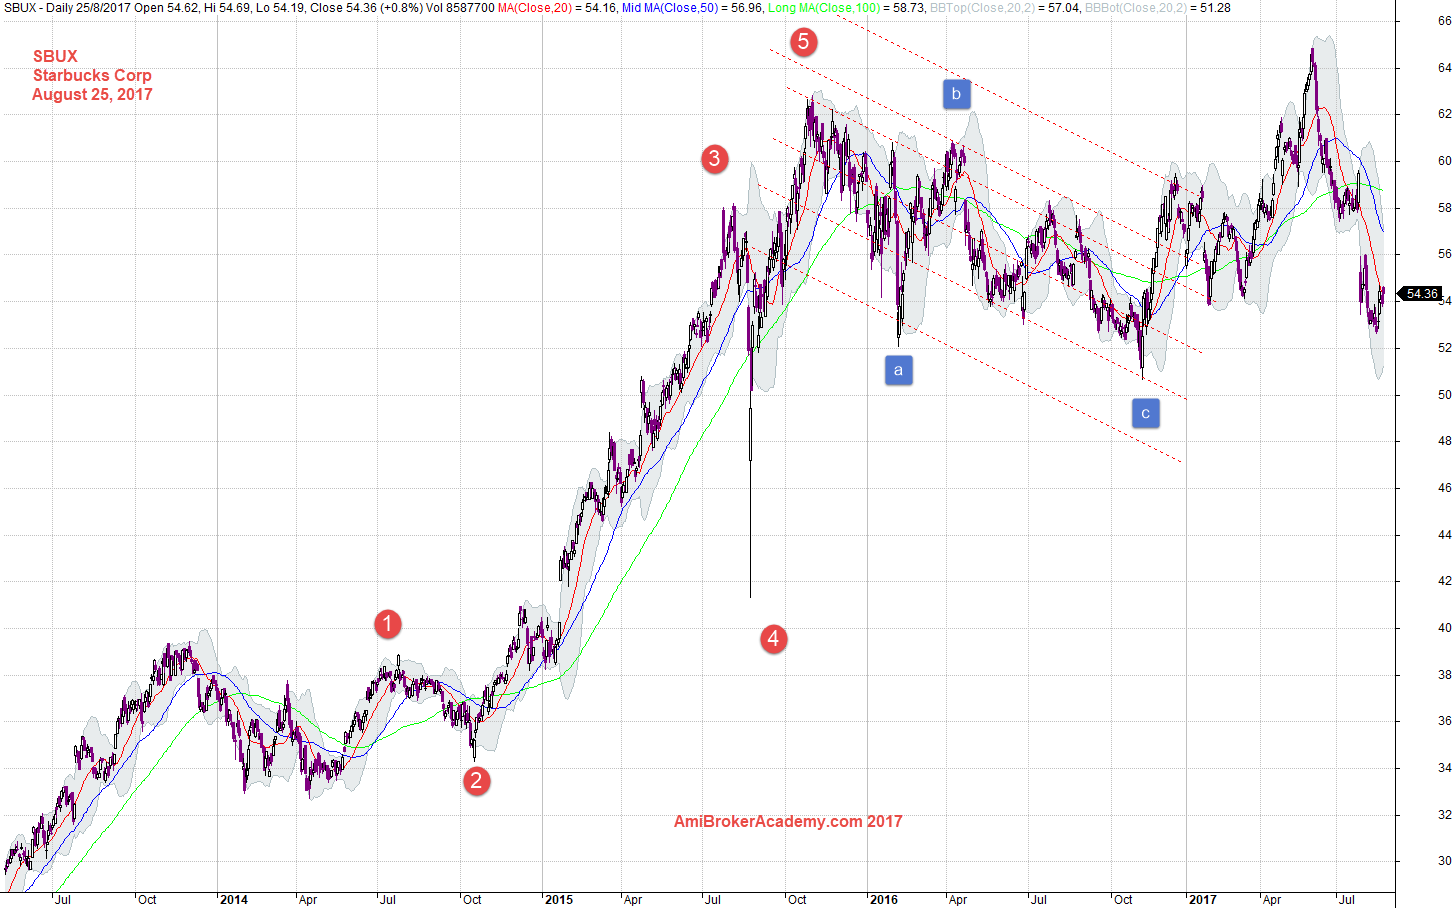
August 25, 2017 Starbucks Corp Data Since 2014 and Wave Count
SBUX Starbucks Corp and Channel
Picture worth a thousand words, see chart for more.
Connecting the low and draw a trendline. Copy and paste the trendline to the peak, we form channel. Besides we see channel, we see bull flag too. Have you?
Have fun! Enjoy learning.
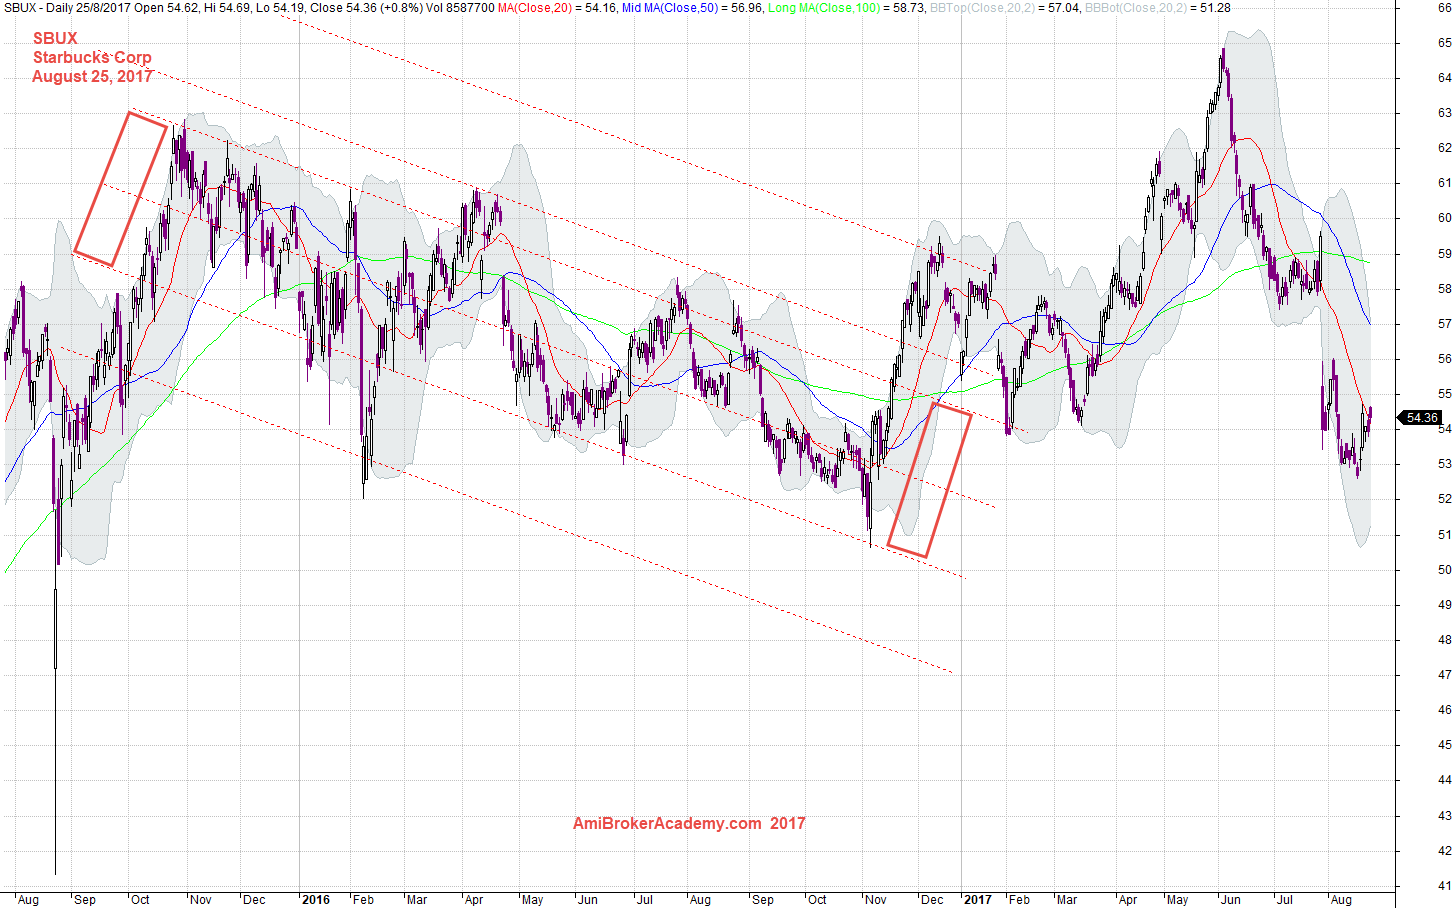
August 25, 2017 Starbucks Corp and Channel
Thanks for visit the site here. You could also find free MACD scan here in this site too.
Moses
AmiBrokerAcademy.com
Disclaimer
The above result is for illustration purpose. It is not meant to be used for buy or sell decision. We do not recommend any particular stocks. If particular stocks of such are mentioned, they are meant as demonstration of Amibroker as a powerful charting software and MACD. Amibroker can program to scan the stocks for buy and sell signals.
These are script generated signals. Not all scan results are shown here. The MACD signal should use with price action. Users must understand what MACD and price action are all about before using them. If necessary you should attend a course to learn more on Technical Analysis (TA) and Moving Average Convergence Divergence, MACD.
Once again, the website does not guarantee any results or investment return based on the information and instruction you have read here. It should be used as learning aids only and if you decide to trade real money, all trading decision should be your own.