July 28, 2014
Moses’ Free Stock MACD Screening Results for July 25, 2014 Singapore Stocks
Welcome to Moses’s Stock Column at AmiBrokerAcademy.com. Thank you for visiting the site. One of the reasons you are here because you want to know which stocks will move.
The Divergence
Divergence is a common trading strategy when use moving average related oscillator. It can be seen in many of the chart, but many could not trade will. Why?
Divergence happens when the price action is forming higher high and the oscillator is forming a lower high. Or when the price action is forming lower low and the oscillator is forming a higher low.
But why sometime the strategy work and some does not. This is just like traffic light, Do you have to stop at the traffic always, no right! Divergence is just like traffic light, so wait for confirmation; only stop when the light turn red.
However, even the divergence has confirmed. Manage your trading risk, by put a stop loss in case the period is too short.
Why MACD Scanner?
It is a great way to search through over nine hundred (900) stocks listed in Singapore Stock Exchange, SGX which one might move using MACD scanner. The scan only takes a few seconds or minutes for slower processor.
But MACD signals are just like thunder and lightning. It warns that might be
raining. It is wise to see raindrops to confirm that it is raining. Don’t jump the gun till you see the confirmation from price action.
To protect your money remember to put an appropriate stop loss.
Free MACD Scan
This site provides you the free MACD scan for Singapore stocks.
This is July 25, 2014 Singapore stocks that have the following MACD signals, which have trading volume greater than 500,000 shares.
Total 73 stocks have MACD bullish and bearish signals, of which only 33 stocks are traded more than 500,000 shares. Only 16 stocks have bullish MACD signals, and 17 stocks have bearish MACD signals. Looks the bulls are in town again.
- MACD line crosses above MACD signal – Bullish trend
- MACD line crosses above zero line – Bullish trend
- MACD Histogram +ve Divergence – Bullish trend
- MACD line crosses below MACD signal – Bearish trend
- MACD line crosses below zero line – Bearish trend
- MACD Histogram -ve Divergence – Bearish trend
- Volume traded greater 500,000 shares
| Ticker | Company | Signals | Close | Vol.(K) | Screening Result |
| G13 | GENTING SINGAPORE PLC | Bullish | 1.335 | 6860 | MACD Cross-Up ZeroLine |
| I07 | ISDN HOLDINGS LIMITED | Bullish | 0.43 | 4757 | MACD Cross-Up ZeroLine |
| P07 | PNE INDUSTRIES LTD | Bullish | 0.22 | 3968 | MACD Cross-Up Signal |
| S63 | SINGAPORE TECH ENGINEERING LTD | Bullish | 3.84 | 2696 | MACD Cross-Up ZeroLine |
| RE4 | GEO ENERGY RESOURCES LIMITED | Bullish | 0.28 | 2639 | MACD Cross-Up Signal |
| 566 | SEE HUP SENG LIMITED | Bullish | 0.3 | 2406 | MACD Cross-Up ZeroLine |
| 5CP | SILVERLAKE AXIS LTD | Bullish | 1.16 | 2174 | MACD Cross-Up ZeroLine |
| D5IU | LIPPO MALLS INDO RETAIL TRUST | Bullish | 0.41 | 1872 | MACD Cross-Up ZeroLine |
| RF1U | RELIGARE HEALTH TRUST | Bullish | 0.94 | 1358 | MACD Cross-Up ZeroLine |
| 5UO | SYSMA HOLDINGS LIMITED | Bullish | 0.26 | 1327 | MACD Cross-Up ZeroLine |
| N03 | NEPTUNE ORIENT LINES LIMITED | Bullish | 0.96 | 1231 | MACD Cross-Up ZeroLine |
| R07 | ROTARY ENGINEERING LIMITED | Bullish | 0.76 | 1118 | MACD Cross-Up Signal |
| G08 | GP BATTERIES INT LTD | Bullish | 0.795 | 1039 | MACD Cross-Up Signal |
| 554 | KING WAN CORPORATION LIMITED | Bullish | 0.35 | 859 | MACD Cross-Up ZeroLine |
| G18 | GRP LTD | Bullish | 0.105 | 580 | MACD Cross-Up Signal |
| C10 | CHOSEN HOLDINGS LIMITED | Bullish | 0.141 | 541 | MACD Cross-Up ZeroLine |
| 5IG | GALLANT VENTURE LTD. | Bearish | 0.32 | 16417 | MACD Cross-Down Signal |
| Z74 | SINGTEL | Bearish | 3.98 | 9855 | MACD -ve Divergence |
| C61U | CAPITACOMMERCIAL TRUST | Bearish | 1.665 | 4525 | MACD Cross-Down Signal |
| K71U | KEPPEL REIT | Bearish | 1.265 | 3061 | MACD Cross-Down Signal |
| A6F | UNIONMET (SINGAPORE) LIMITED | Bearish | 0.06 | 2700 | MACD Cross-Down Signal |
| 5CQ | TECHNICS OIL & GAS LIMITED | Bearish | 0.83 | 2017 | MACD Cross-Down Signal |
| 5GC | CNA GROUP LTD. | Bearish | 0.083 | 1854 | MACD Cross-Down Signal |
| L03 | LIAN BENG GROUP LTD | Bearish | 0.725 | 1620 | MACD Cross-Down Signal |
| 5FL | FALCON ENERGY GROUP LIMITED | Bearish | 0.425 | 1480 | MACD -ve Divergence |
| J85 | CDL HOSPITALITY TRUSTS | Bearish | 1.77 | 1388 | MACD Cross-Down Signal |
| K2LU | CACHE LOGISTICS TRUST | Bearish | 1.21 | 1036 | MACD Cross-Down Signal |
| Q5T | FAR EAST HOSPITALITY TRUST | Bearish | 0.875 | 882 | MACD Cross-Down ZeroLine |
| P11 | PACIFIC ANDES RESOURCES DEVLTD | Bearish | 0.122 | 706 | MACD Cross-Down Signal |
| 583 | PROGEN HOLDINGS LTD | Bearish | 0.144 | 678 | MACD Cross-Down Signal |
| 5LY | MARCO POLO MARINE LTD. | Bearish | 0.35 | 559 | MACD Cross-Down ZeroLine |
| V03 | VENTURE CORPORATION LIMITED | Bearish | 7.95 | 558 | MACD Cross-Down Signal |
| 560 | AZTECH GROUP LTD. | Bearish | 0.142 | 540 | MACD Cross-Down Signal |
Straits Times Index
Straits Times Index, STI gaps down and closed at 3350.17 points, STI closes 3.72 points lower from the last closed at 3353.89 points. Is STI forming the evening star candlestick pattern?
STI has rally for the last seven months, STI is on an uptrend. STI has swing low from 2950 to swing high of 3356.
July 25, 2014 Straits Times Index STI Daily Chart
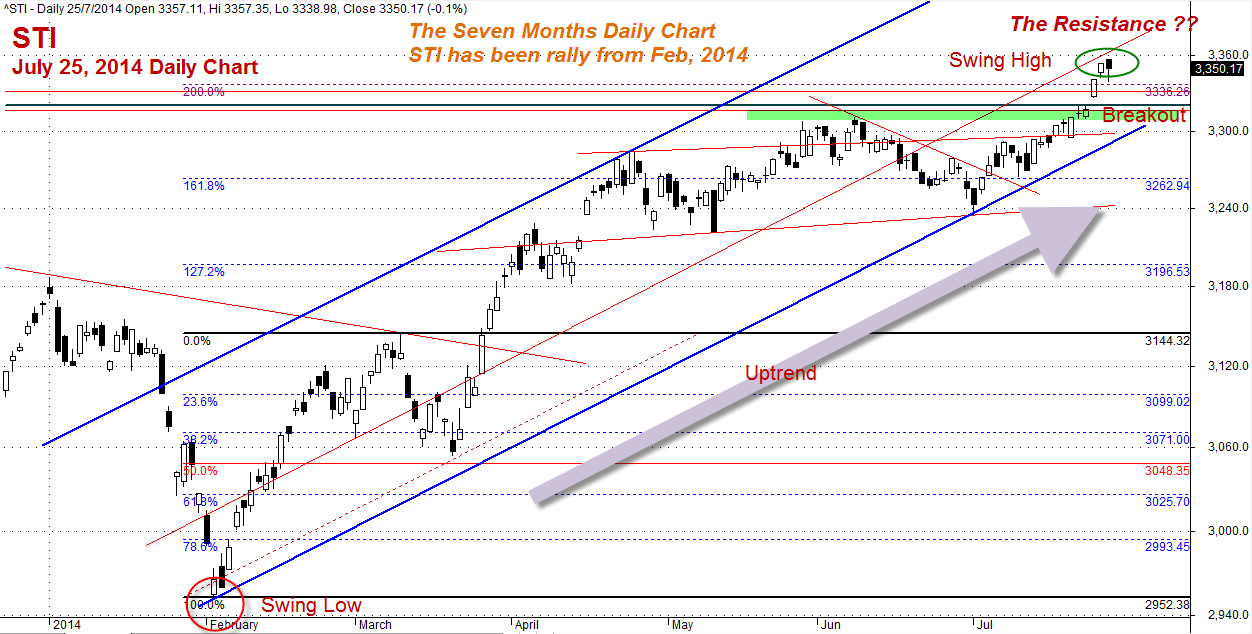
Straits Times Index, Window to Singapore Economy, July 25, 2014 Daily Chart
Thanks for visiting the site, AmiBrokerAcademy.com.
Moses
DISCLAIMER
Information provided here is of the nature of a general comment only and no intend to be specific for trading advice. It has prepared without regard to any particular investment objectives, financial situation or needs. Information should not be considered as an offer or enticement to buy, sell or trade.
You should seek advice from your broker, or licensed investment advisor, before taking any action.
Once again, the website does not guarantee any results or investment return based on the information and instruction you have read here. It should be used as learning aids only and if you decide to trade real money, all trading decision should be your own.