September 24, 2017
^VIX and Channel
Picture worth a thousands words, see chart for more. ^VIX goes lower. Connect the low and draw a trendline, copy and paste the trendline to the peak, forms the channel. The channel slopping down.
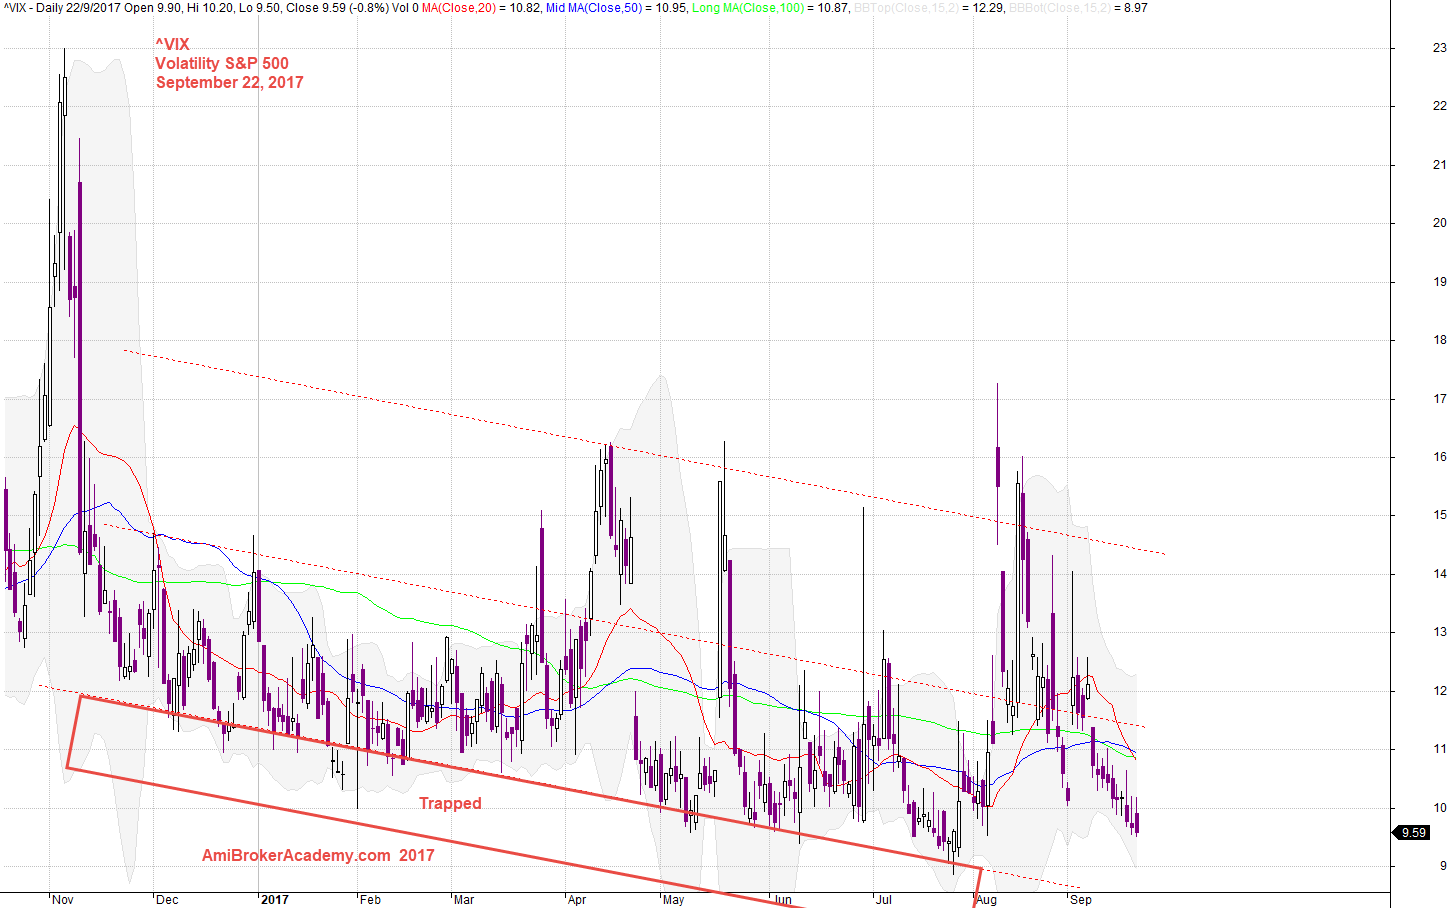
September 22, 2017 ^VIX Volatility S&P 500 Index and Channels
^VIX Volatility S&P 500 and Levels
See chart, the price action moving lower, layer by layer.
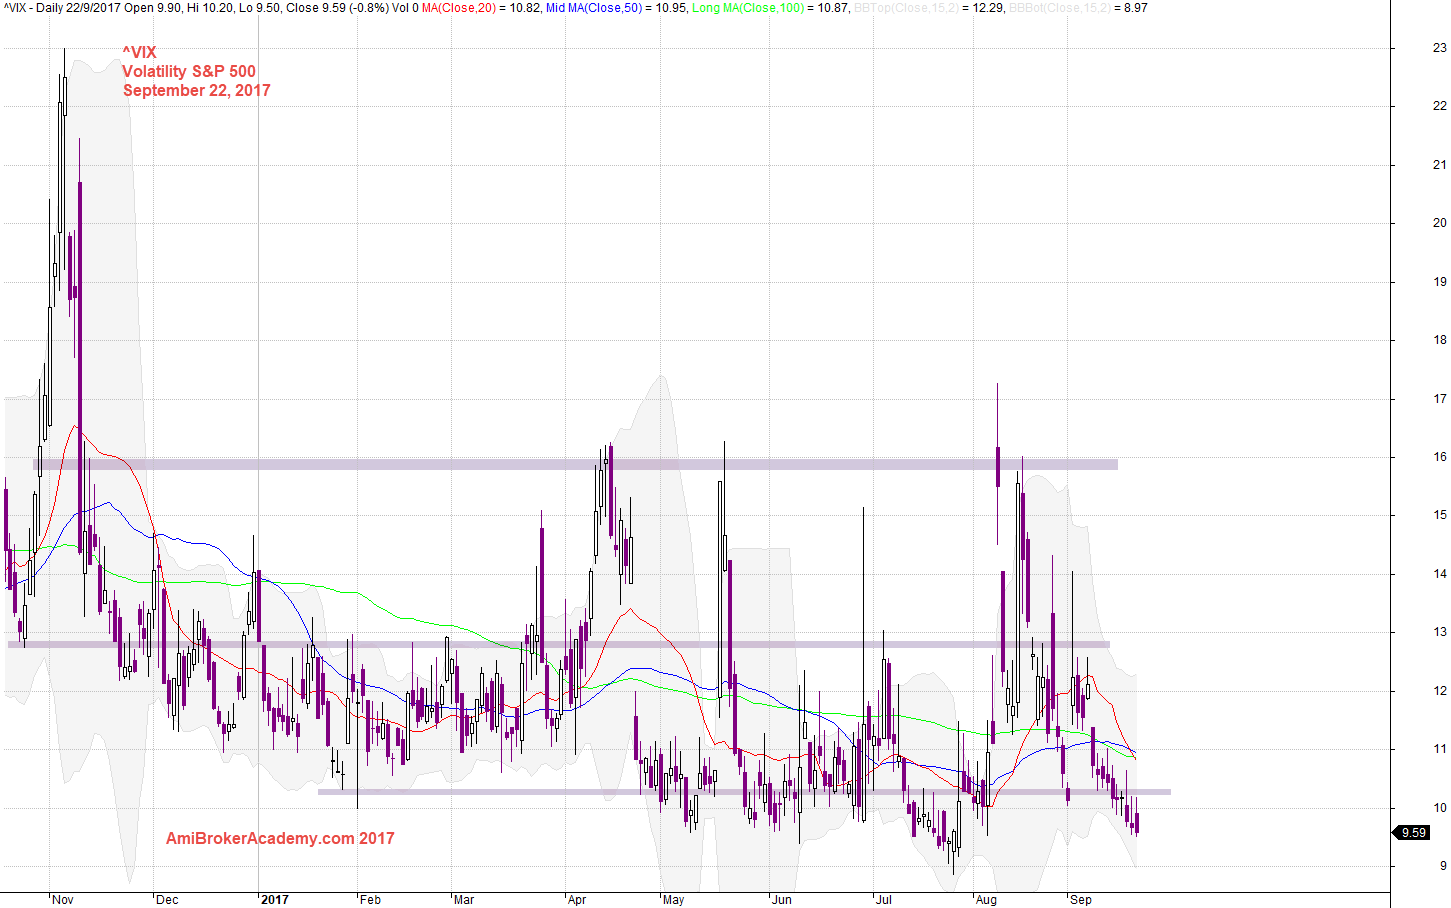
September 22, 2017 Volatility S&P 500 and Levels
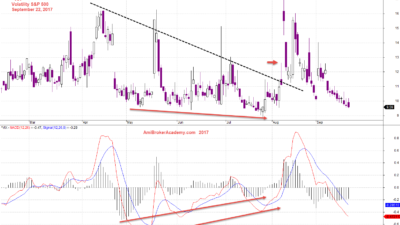
September 22, 2017 Volatility S&P 500 and MACD Divergence Signal
^VIX Volatility Index (Volatility S&P 500) and MACD Signals
Picture worth a thousand words, see chart for more.
The price action is moving lower, MACD strength is moving higher, higher low. Changing trend direction? Will see.
Moses
AmiBrokerAcademy.com
Disclaimer
The above result is for illustration purpose. It is not meant to be used for buy or sell decision. We do not recommend any particular stocks. If particular stocks of such are mentioned, they are meant as demonstration of Amibroker as a powerful charting software and MACD. Amibroker can program to scan the stocks for buy and sell signals.
These are script generated signals. Not all scan results are shown here. The MACD signal should use with price action. Users must understand what MACD and price action are all about before using them. If necessary you should attend a course to learn more on Technical Analysis (TA) and Moving Average Convergence Divergence, MACD.
Once again, the website does not guarantee any results or investment return based on the information and instruction you have read here. It should be used as learning aids only and if you decide to trade real money, all trading decision should be your own.