November 12, 2017
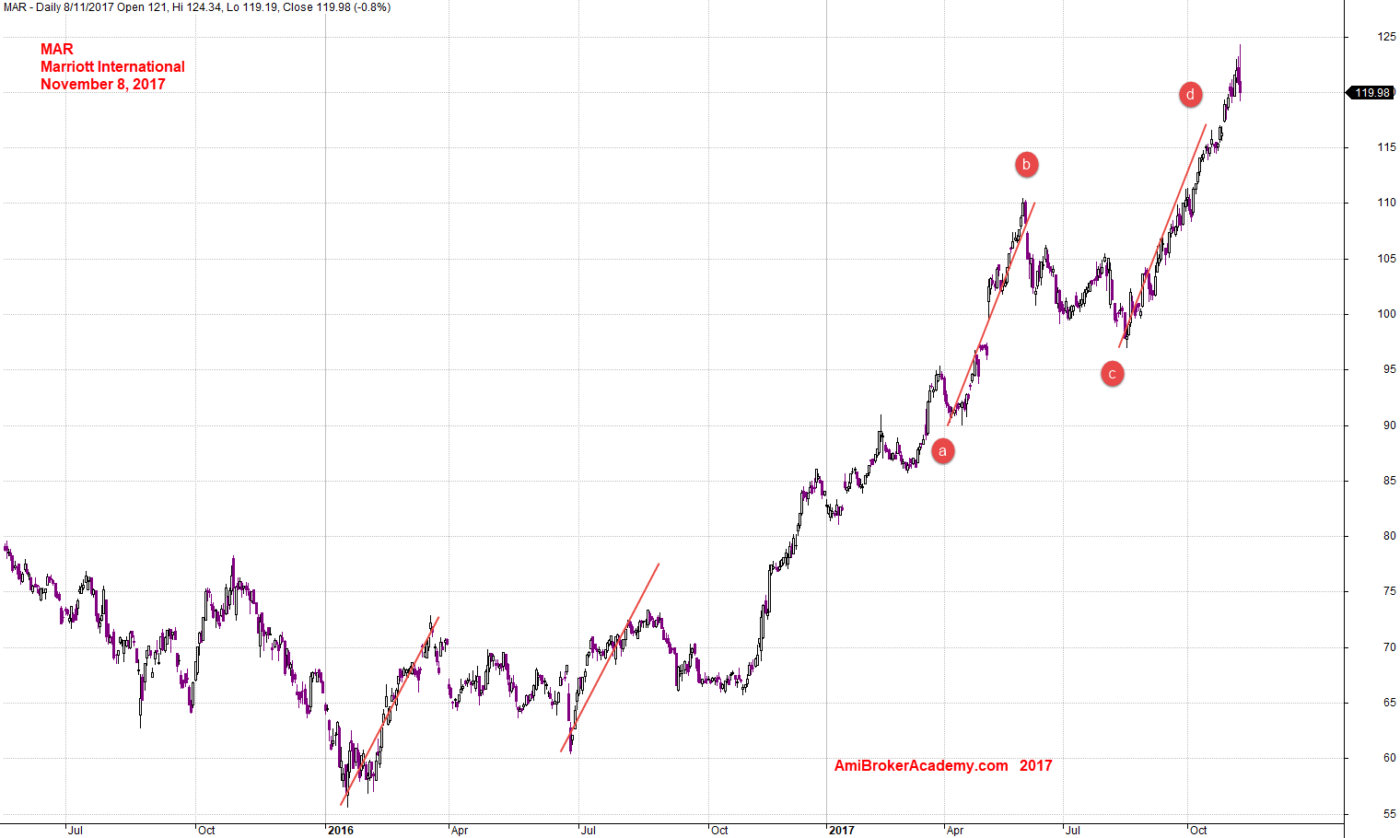
MAR Marriott Internationl and Gartley ABCD Pattern
In your observation, have you find that price action is moving in zigzag manner. So, when you find the price is moving so rapidly in the bullish manner. do not worry. The price action will sure to pullback before it rush up again. And this is one of the ABCD basis too, AB rally, BC pullback, and CD rally again. And what happen after CD, of course pullback, that is why in a bullish ABCD pattern, the next expectation is to sell, So, what you see on the chart is a ABCD sell pattern. As how far can the pullback happen no one can determine, even the company themself. The price movement is all determined by the market emotions, and that is why that most traders like US market, as it is not easy for any big institution to manipulate the stock price, as it is too “deep”, if you do not believe check out the Japanese Yen, how many times the Japanese government intervene, and how much correction can the done, very little.
So, when you ready to buy a stock and the price action are so bullish, wait for the pullback and not head one. Although it could be still quite safe to buy high and sell higher. In this case, you are expecting many of investors still believe the stock is cheap.
November 8, 2017 Marriott International and ABCD Pattern
MAR Marriott International and Channel
Use channel to guide your price action trend. Is this the only channel? Will see charts below. It all depending your trading habit, long term, short term and so on.
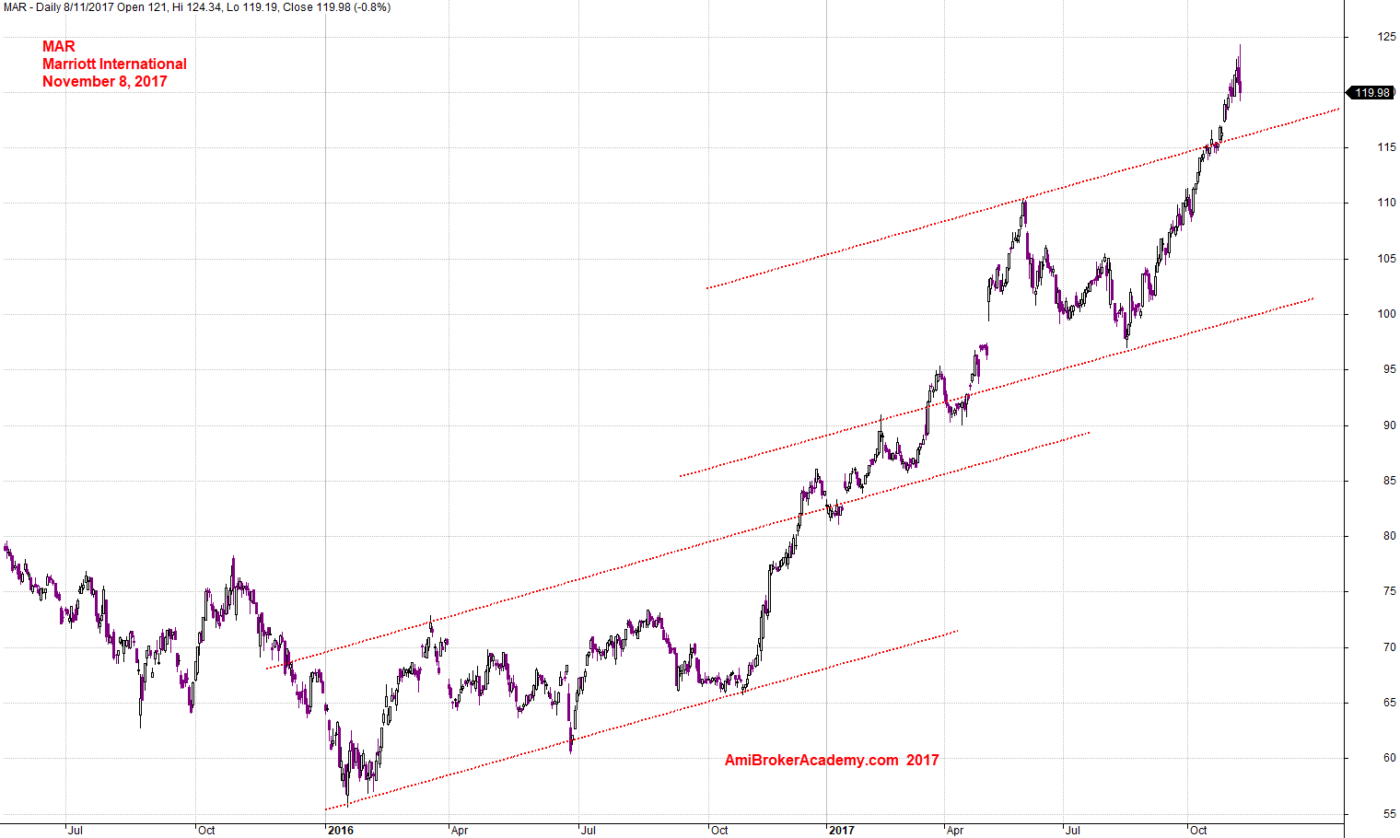
November 8, 2017 Marriott International and Channel
MAR Marriott International and Channel
See chart for more, if your observant you will notice the chart was taken on the November 10, but the channel is enforce, as the price action still trapped within the channel.
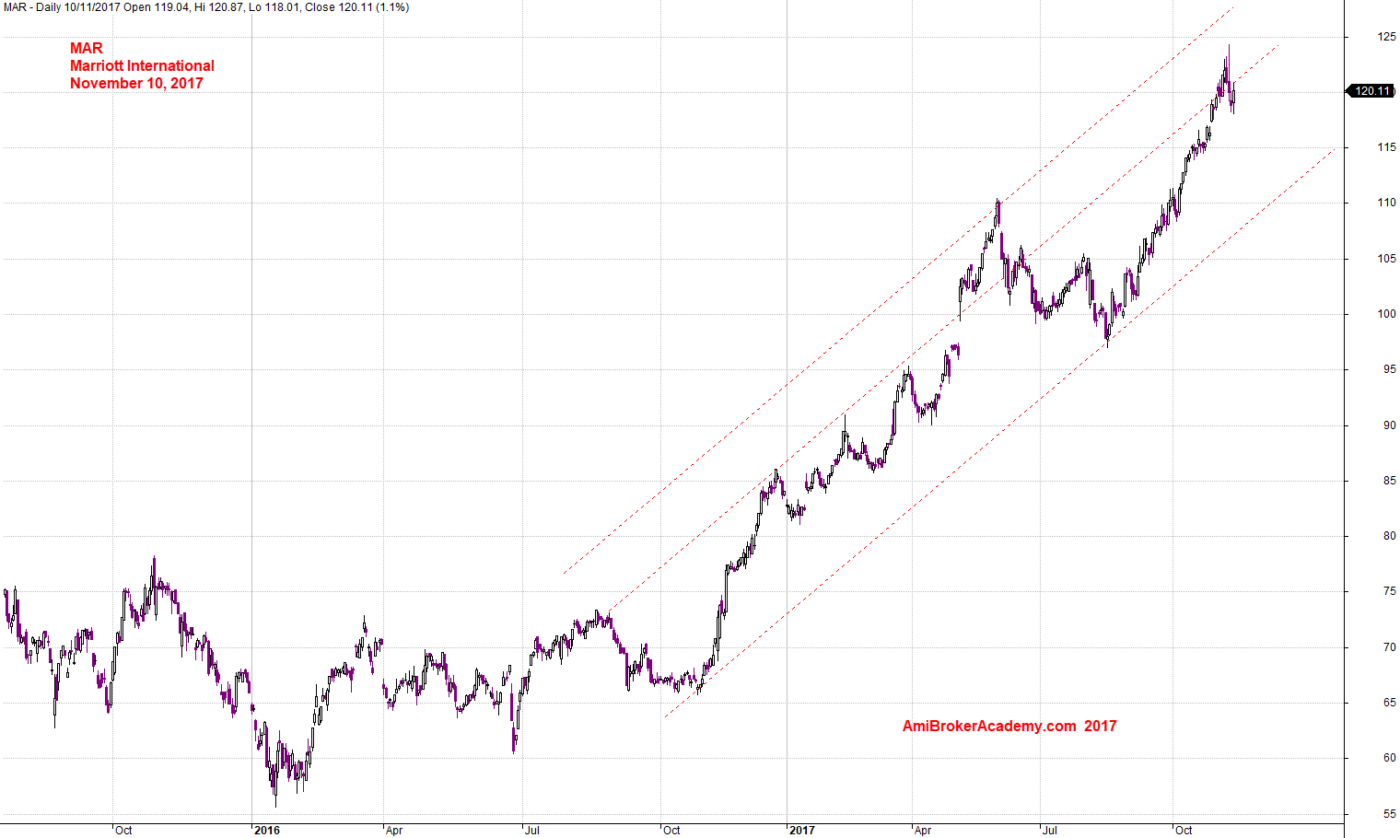
November 10, 2017 Marriott International and Channel
MAR Marriott International and Channel
As said, it depends on your trading style, you can draw your channel according to your style. See chart below for another example.
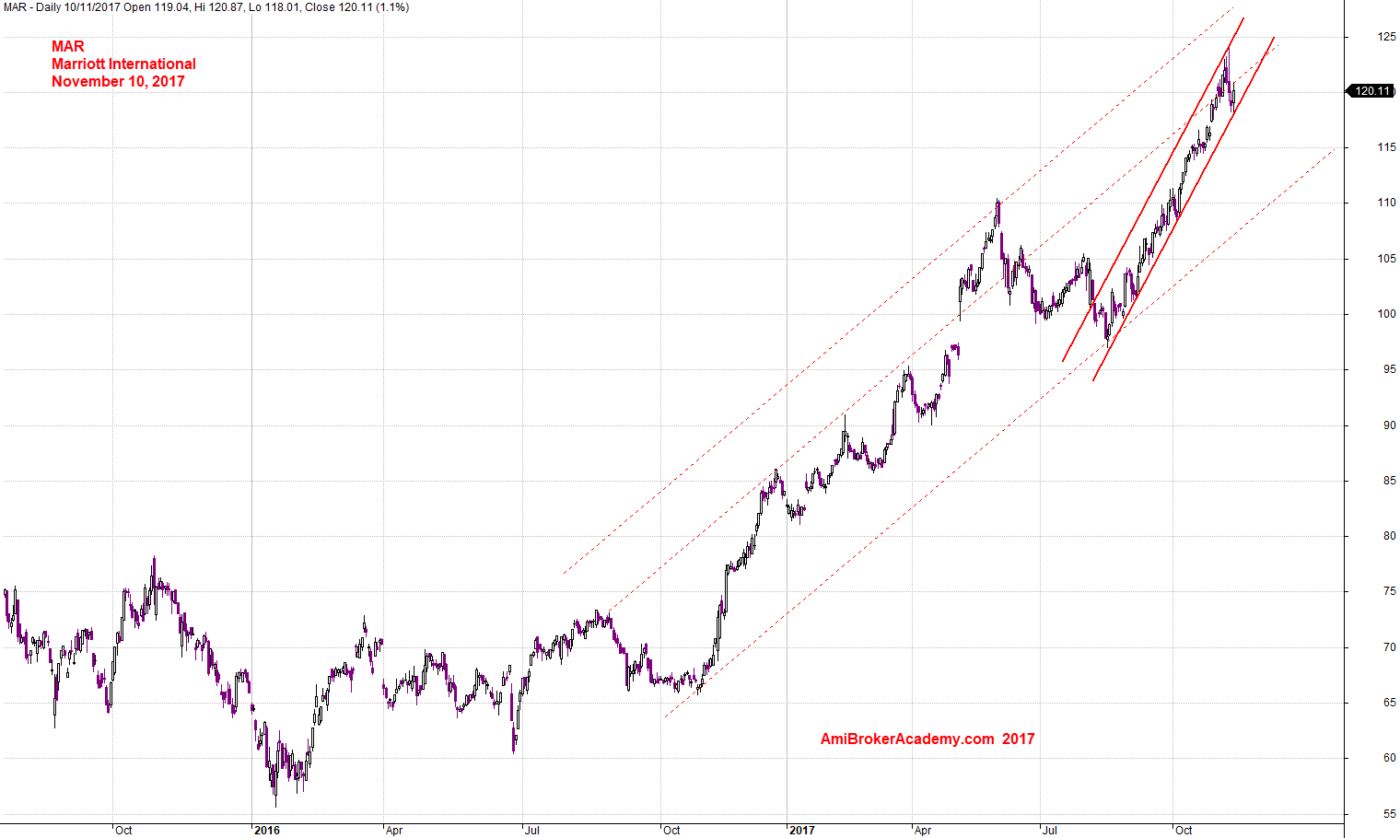
November 10, 2017 Marriott International and Channel
MAR Marriott International and Wave Count
See chart for more, wave count help to project the next price direction.
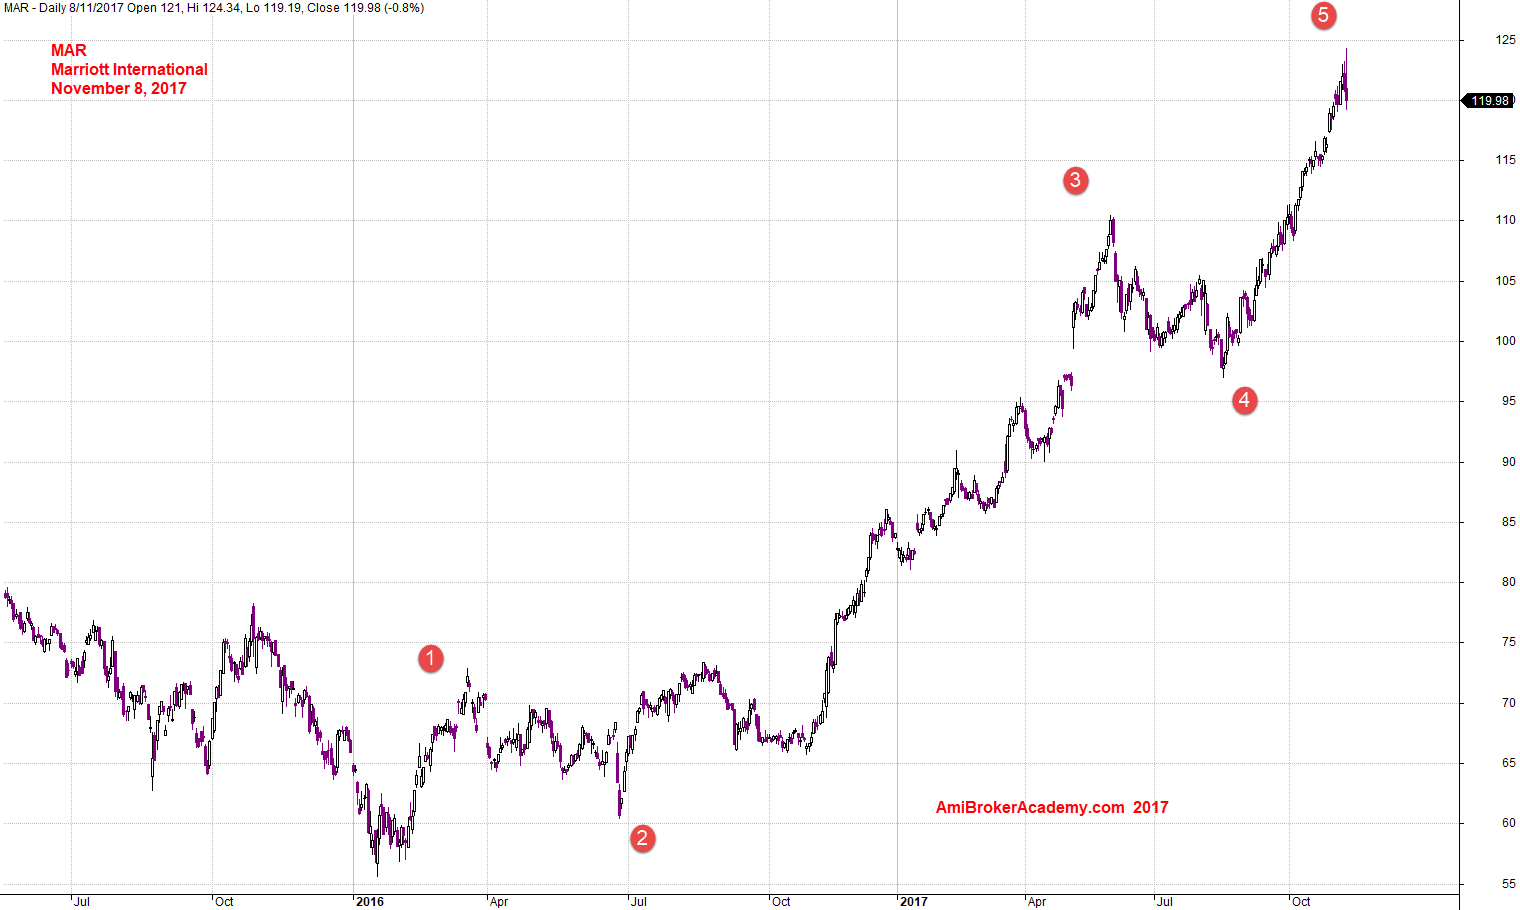
November 8, 2017 Marriott International and Wave Count
HM Gartley ABCD Pattern, Support Resistance, Channel and Moving Average are great tool to reference for trade. See the examples using CBS. Have fun!
Think Think
Think think got more thing, just in case, we are not AmiBroker, we are just AmiBroker’s fan and enthusiast. Contact them for more. Kudos to Tomasz Janeczko, the founder of AmiBroker.
Moses
AmiBrokerAcademy.com
Disclaimer
The above result is for illustration purpose. It is not meant to be used for buy or sell decision. We do not recommend any particular stocks. If particular stocks of such are mentioned, they are meant as demonstration of Amibroker as a powerful charting software and MACD. Amibroker can program to scan the stocks for buy and sell signals.
These are script generated signals. Not all scan results are shown here. The MACD signal should use with price action. Users must understand what MACD and price action are all about before using them. If necessary you should attend a course to learn more on Technical Analysis (TA) and Moving Average Convergence Divergence, MACD.
Once again, the website does not guarantee any results or investment return based on the information and instruction you have read here. It should be used as learning aids only and if you decide to trade real money, all trading decision should be your own.