January 6, 2018
At the start of the year, it is a great idea to see the big picture and plan for the next few months. Look Left Think Right.
Singapore Stock Analysis
^STI The Straits Times Index and Year High Low
STI touch 3470 level and pullback and breakout below 3400 level. This is to get ready to bounce higher.
Powerful Chart Software – AmiBroker
The following chart is produced using AmiBroker charting software. It is a powerful chart software. You plot the stocks you are interested all in one chart, as long as you still could read them. See chart below.
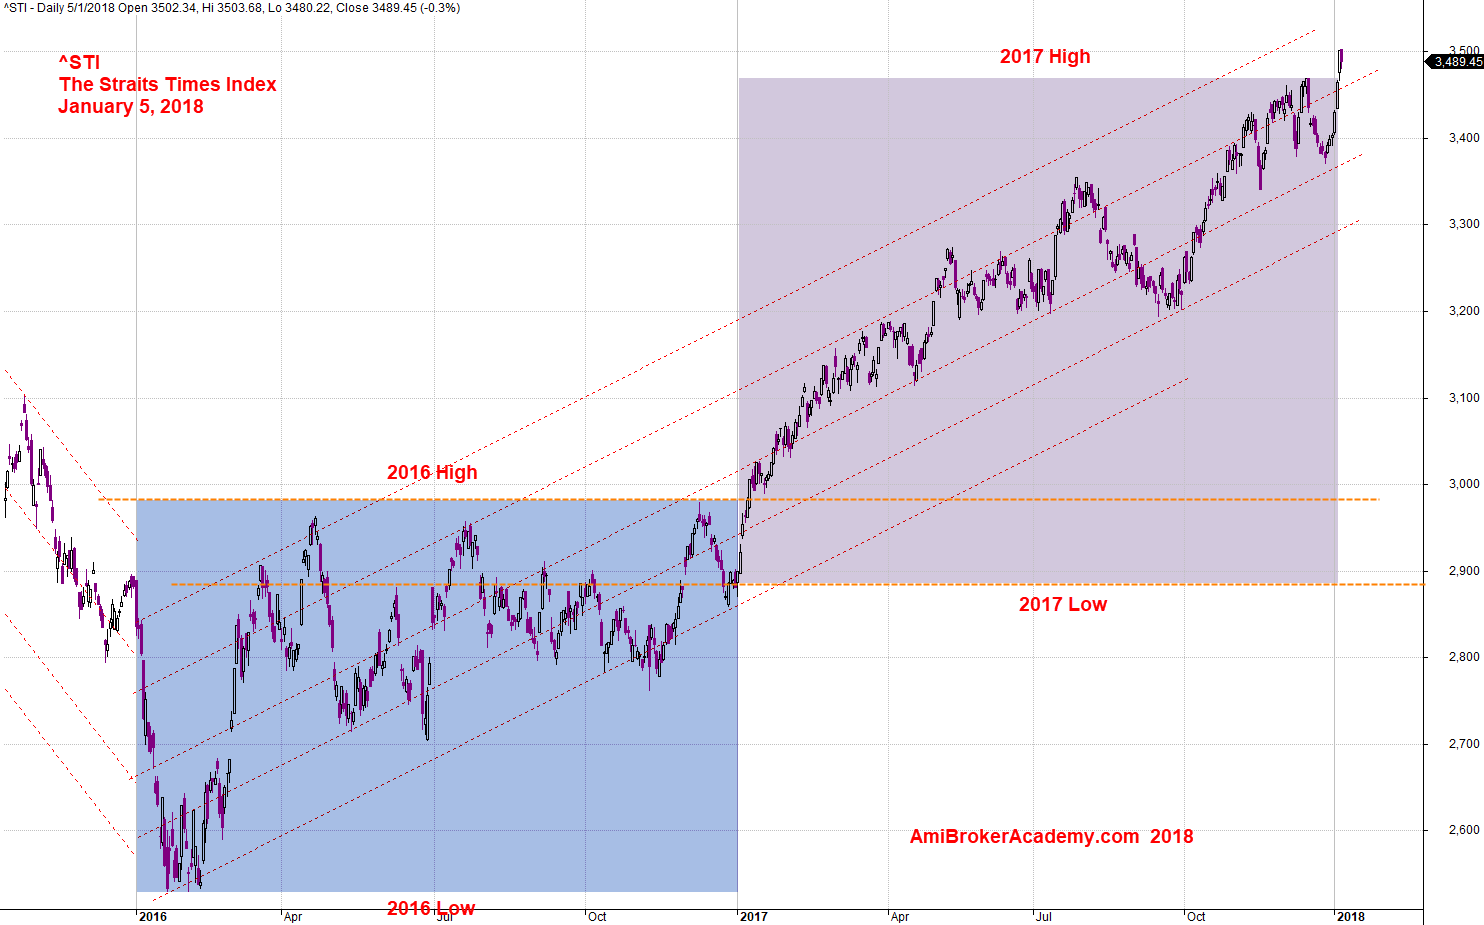
January 5, 2018 The Straits Times Index Year High Low
STI The Straits Times Index Month High Low and Strong Levels
See chart, STI trys to breakout lower near 3200 level, but can not. STI than bounced up and moved higher.
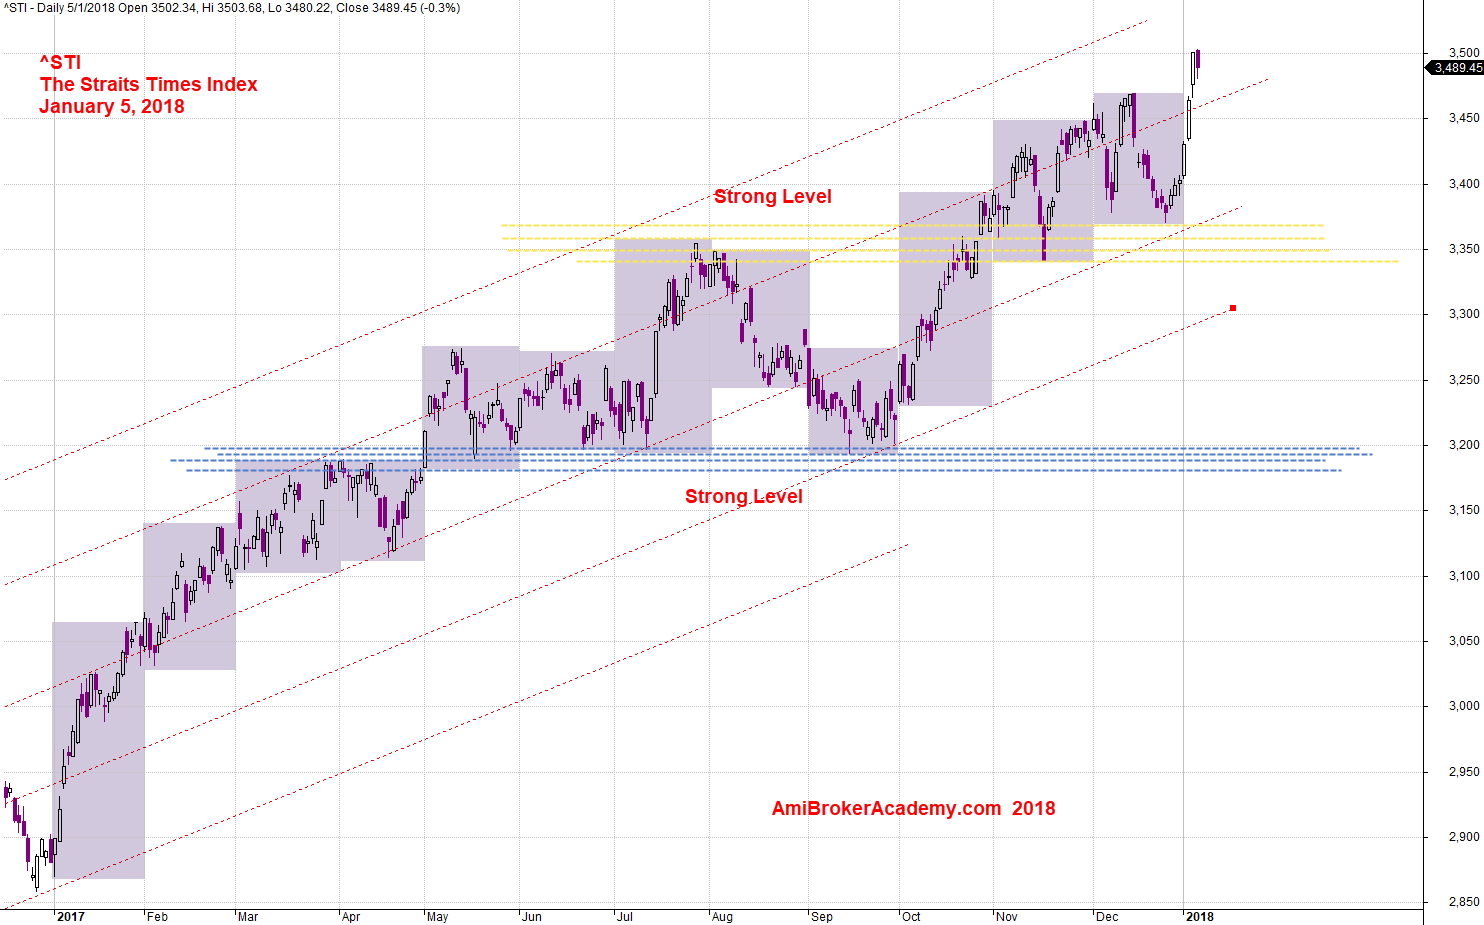
January 5, 2018 The Straits Times Index and Month High Low
^STI The Straits Times Index and ABCD Patterns and Levels
See chart STI’s ABCD patterns, and levels.
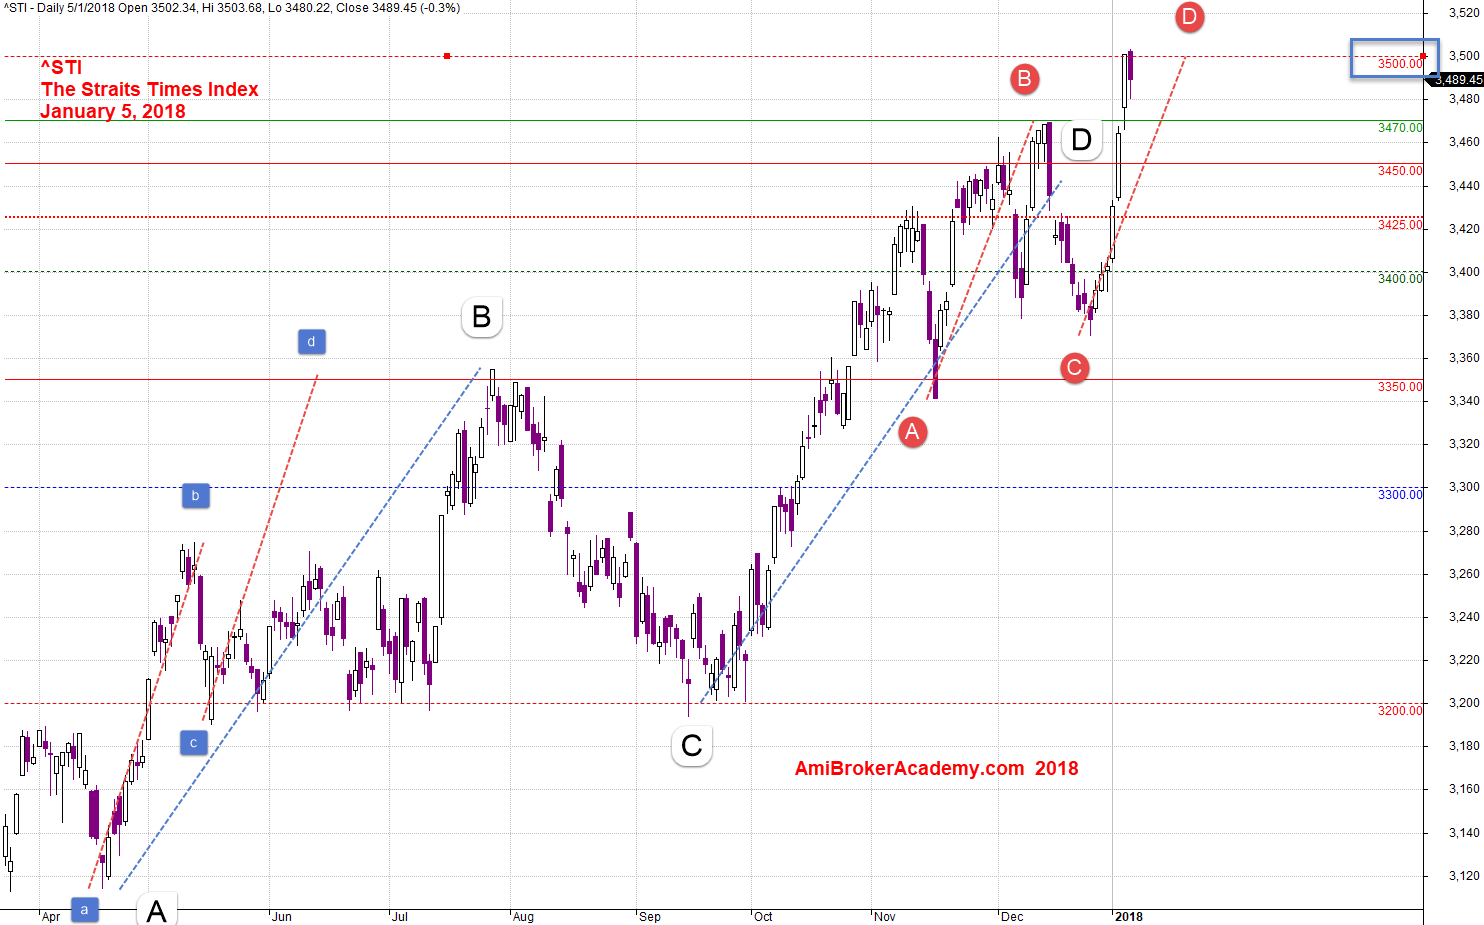
January 5, 2018 The Straits Times Index and Levels
Moses
AmiBrokerAcademy.com
Disclaimer
The above result is for illustration purpose. It is not meant to be used for buy or sell decision. We do not recommend any particular stocks. If particular stocks of such are mentioned, they are meant as demonstration of Amibroker as a powerful charting software and MACD. Amibroker can program to scan the stocks for buy and sell signals.
These are script generated signals. Not all scan results are shown here. The MACD signal should use with price action. Users must understand what MACD and price action are all about before using them. If necessary you should attend a course to learn more on Technical Analysis (TA) and Moving Average Convergence Divergence, MACD.
Once again, the website does not guarantee any results or investment return based on the information and instruction you have read here. It should be used as learning aids only and if you decide to trade real money, all trading decision should be your own.