June 3, 2017
Amazon.com Inc Daily
Picture worth a thousand words. See the chart below the stock finally breakout one thousand dollars. There are many ABCD Chart pattern. So, in order for the price to gain strength, it has to pullback first.
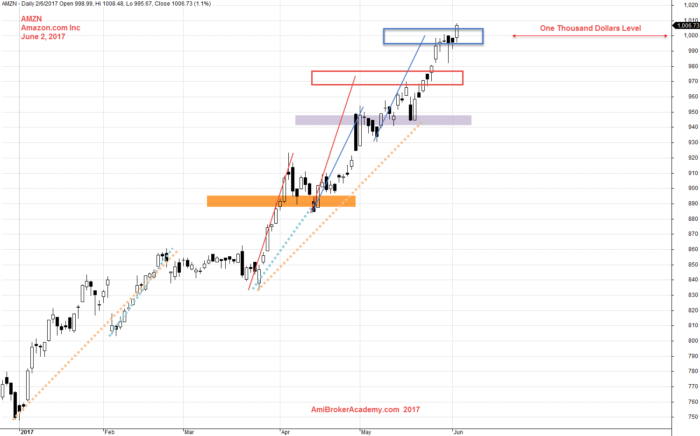
June 2, 2017 Amazon.com and ABCD Chart Pattern
Benchmark Google and Amazon.com Inc
Picture worth a thousand words.
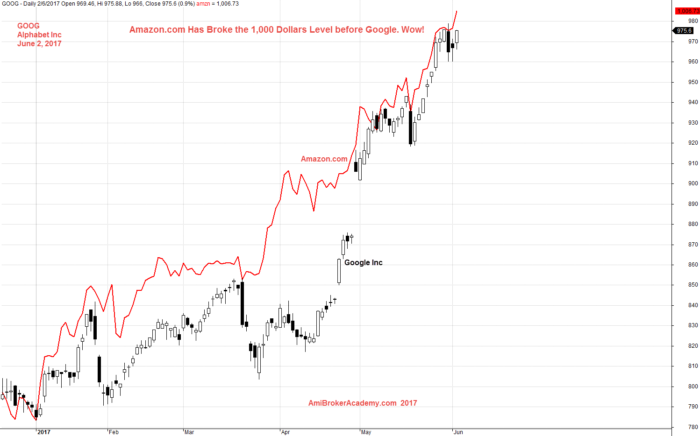
June 2, 2017 GOOG and Amazon.com Inc benchmark
Moses Stock Analysis
AmiBrokerAcademy.com
Disclaimer
The above result is for illustration purpose. It is not meant to be used for buy or sell decision. We do not recommend any particular stocks. If particular stocks of such are mentioned, they are meant as demonstration of Amibroker as a powerful charting software and MACD. Amibroker can program to scan the stocks for buy and sell signals.
These are script generated signals. Not all scan results are shown here. The MACD signal should use with price action. Users must understand what MACD and price action are all about before using them. If necessary you should attend a course to learn more on Technical Analysis (TA) and Moving Average Convergence Divergence, MACD.
Once again, the website does not guarantee any results or investment return based on the information and instruction you have read here. It should be used as learning aids only and if you decide to trade real money, all trading decision should be your own.