June 10, 2017
This is an in stock! Everyone is being caught in the social networking. Through the social networking you can make friends with distant ‘friend’ where you have not been traveled to yet. This seems to be the kind of things the Gen Y enjoy doing it.
Watch out, how many can survival? There is a convergence to come, for the online shopping, social networking, and so on to come together.
Hope you will enjoy the ride with the catch on. The price just keep forming higher high after a triple bottom.
But, be sensible never try to buy high and sell higher high; risky.
Again we don’t like to pick the tops or bottoms! Remember no right no wrong.
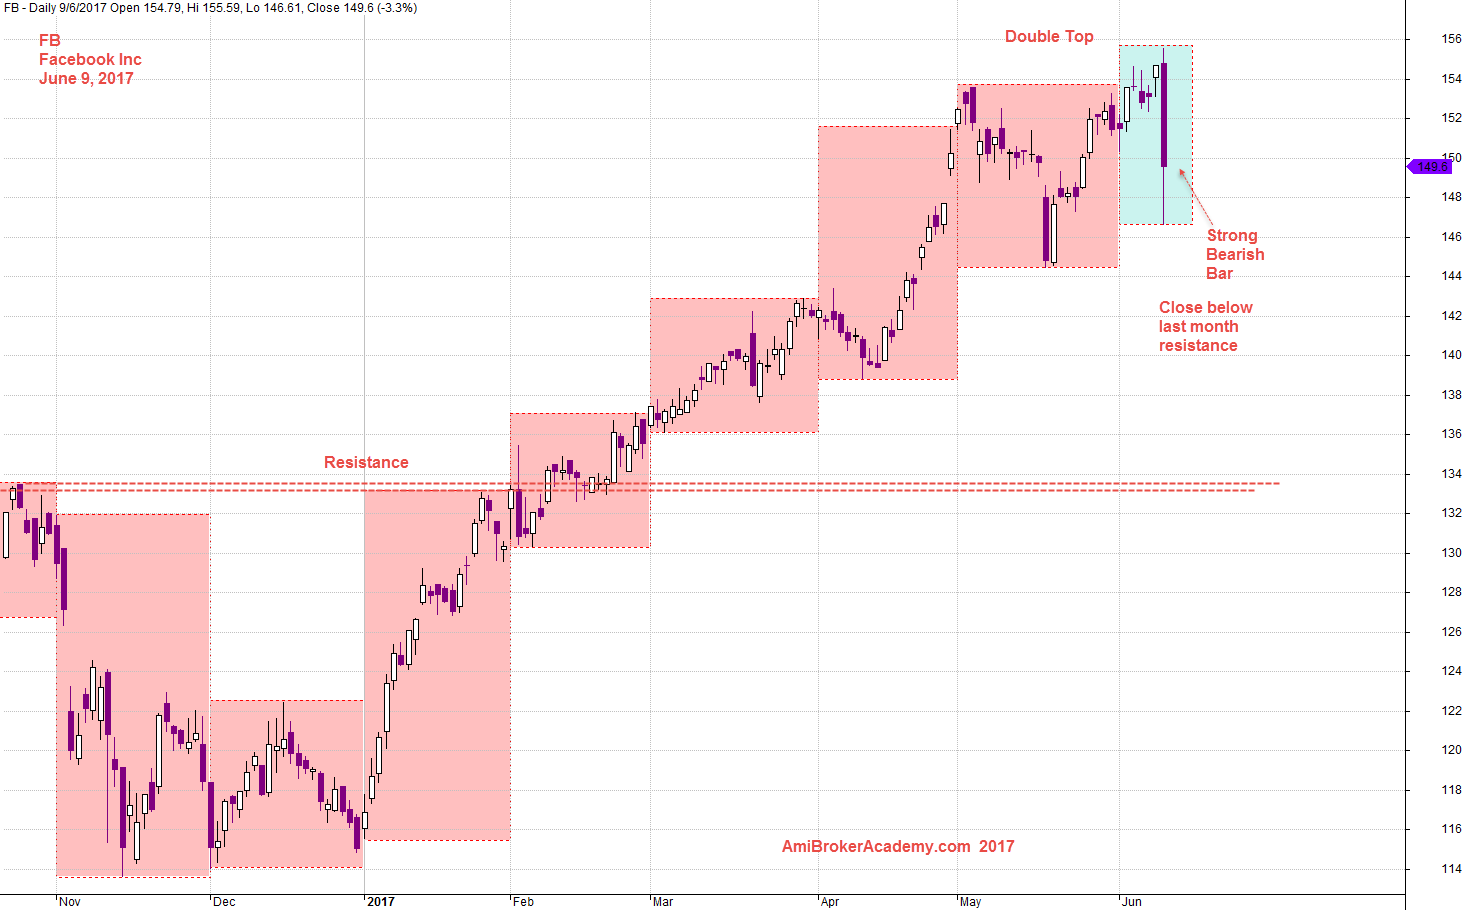
Facebook Inc and Support Resistance
Picture worth a thousand words.
See the resistance turns support, uptrend. But the price action may hit a strong resistance. Chart shows a slow down in breaking higher. The best is in the last trading day, at June 9 the market seems to feel the price is too high now.
The price has breakout below two months resistance, waw!
Facebook Inc and Support Resistance
Facebook and NASDAQ Benchmarking
Picture worth a thousand words. Reading benchmark, what have you got enlighten? There seems to cross it up and down for a start. And finally they seems to be convergence.
You can easily recognize that after the bullish close above then suddenly close below last month resistance.
I do not know what is the market is thinking now.
Now, the price has close below the last month high.
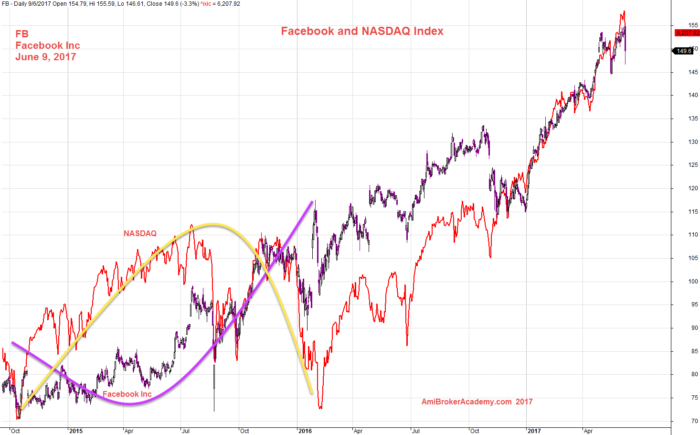
June 9, 2017 Facebook benchmark NASDAQ Index
Facebook Inc and MACD Indicator
Divergence! Trend ending? May be just for short term. May be it is great to wait another day lah (Singlish)!
Watch out!
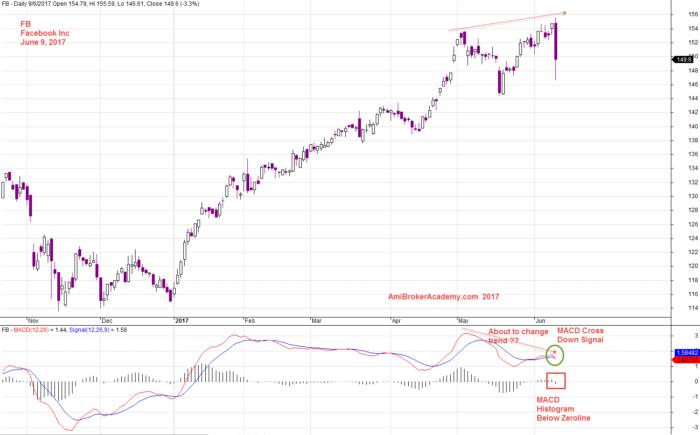
June 9, 2017 Facebook Inc and MACD Indicator
Caution! This site is not for you. It is not for every trader.
The analysis here is intended to be a tutorial only. We look at the chart from different views. We mainly study the popular stocks in US market and Singapore. Hope you can learn something. There is no right no wrong.
Moses Stock Analysis
AmiBrokerAcademy.com
Disclaimer
The above result is for illustration purpose. It is not meant to be used for buy or sell decision. We do not recommend any particular stocks. If particular stocks of such are mentioned, they are meant as demonstration of Amibroker as a powerful charting software and MACD. Amibroker can program to scan the stocks for buy and sell signals.
These are script generated signals. Not all scan results are shown here. The MACD signal should use with price action. Users must understand what MACD and price action are all about before using them. If necessary you should attend a course to learn more on Technical Analysis (TA) and Moving Average Convergence Divergence, MACD.
Once again, the website does not guarantee any results or investment return based on the information and instruction you have read here. It should be used as learning aids only and if you decide to trade real money, all trading decision should be your own.