1 April, 2017
Moses Stock Trading Blog Site – AmiBrokerAcademy.com
Thank you for visiting the amibrokeracademy.com blog site. No one doing analysis like what you read here.
Welcome to Moses’s US Stock Analysis @ AmiBrokerAcademy.com.
Facebook Inc Charting
Small bar. Price close back down. However, the price is above 20 MA. It is still young to trade the reversal. Let the price dip first, in other words, only till you see lower low, lower high.
Let’s add an indicator to test the price action. MACD is a good leading indicator. See chart follows.
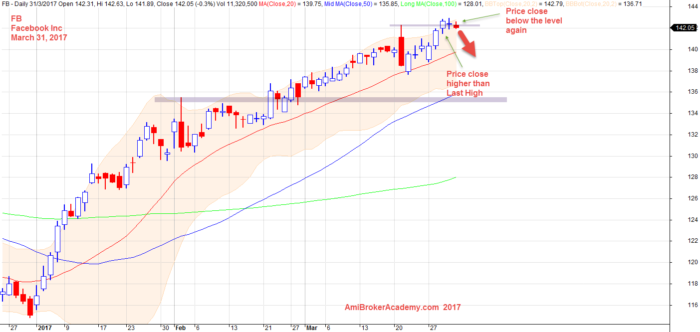
March 31, 2017 Facebook Charting
Facebook Inc Charting with MACD Indicator
You can see a big -ve Divergence. So, you will expect the trend will take a long time to change. Will see.
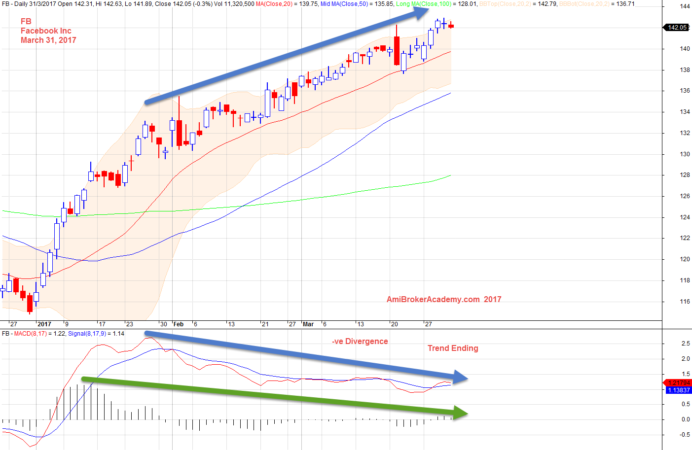
March 31, 2017 Facebook and -ve MACD Divergence
Remember, trading is not a get rich fast business like many have advertised. It needs a lot of hard work and good money and risk management.
Have fun! Happy learning.
Moses US Stock Analysis
AmiBrokerAcademy.com
Disclaimer
The above result is for illustration purpose. It is not meant to be used for buy or sell decision. We do not recommend any particular stocks. If particular stocks of such are mentioned, they are meant as demonstration of Amibroker as a powerful charting software and MACD. Amibroker can program to scan the stocks for buy and sell signals.
These are script generated signals. Not all scan results are shown here. The MACD signal should use with price action. Users must understand what MACD and price action are all about before using them. If necessary you should attend a course to learn more on Technical Analysis (TA) and Moving Average Convergence Divergence, MACD.
Once again, the website does not guarantee any results or investment return based on the information and instruction you have read here. It should be used as learning aids only and if you decide to trade real money, all trading decision should be your own.