January 19, 2018
DXY Dollar Index as Indicator
DXY is a very important indicator to gage the strength of US dollar.
US Stock Analysis
Dollar Index Quarter and Year High Low
Study the following chart and plan your trade in 2018.
The Dollar Index is now retest the 2015 low, or 2014 high. So, what? What do you think. The Dollar Index broke the very important level; broke the recent support. This is a valid breakout, but it is still likely to retrace back to level such as 91 or maybe higher 92. 91 and 92 were the two support level in the past. If the momentum continue, the Dollar Index is likely to reach the 89, or 88 level. Why? Look left and you will see why. These levels that mentioned here are obvious turning points, they made a impact to the market for sure. Have fun!
If you study the chart, you will find DXY was on a bullish trend, as the index formed higher high and higher low. The bullish trend was till end 2016. Thereafter you will realize that the trend end, the begin to change. You see DXY start to form lower high and lower low. Is it true bearish? At least for now.
Picture worth a thousand words, see chart and think, think think (think more) and got more things. Have fun!
Manage your risk.
Powerful Chart Software – AmiBroker
The following chart is produced using AmiBroker charting software. It is a powerful chart software. You plot the stocks you are interested all in one chart, as long as you still could read them. See chart below.
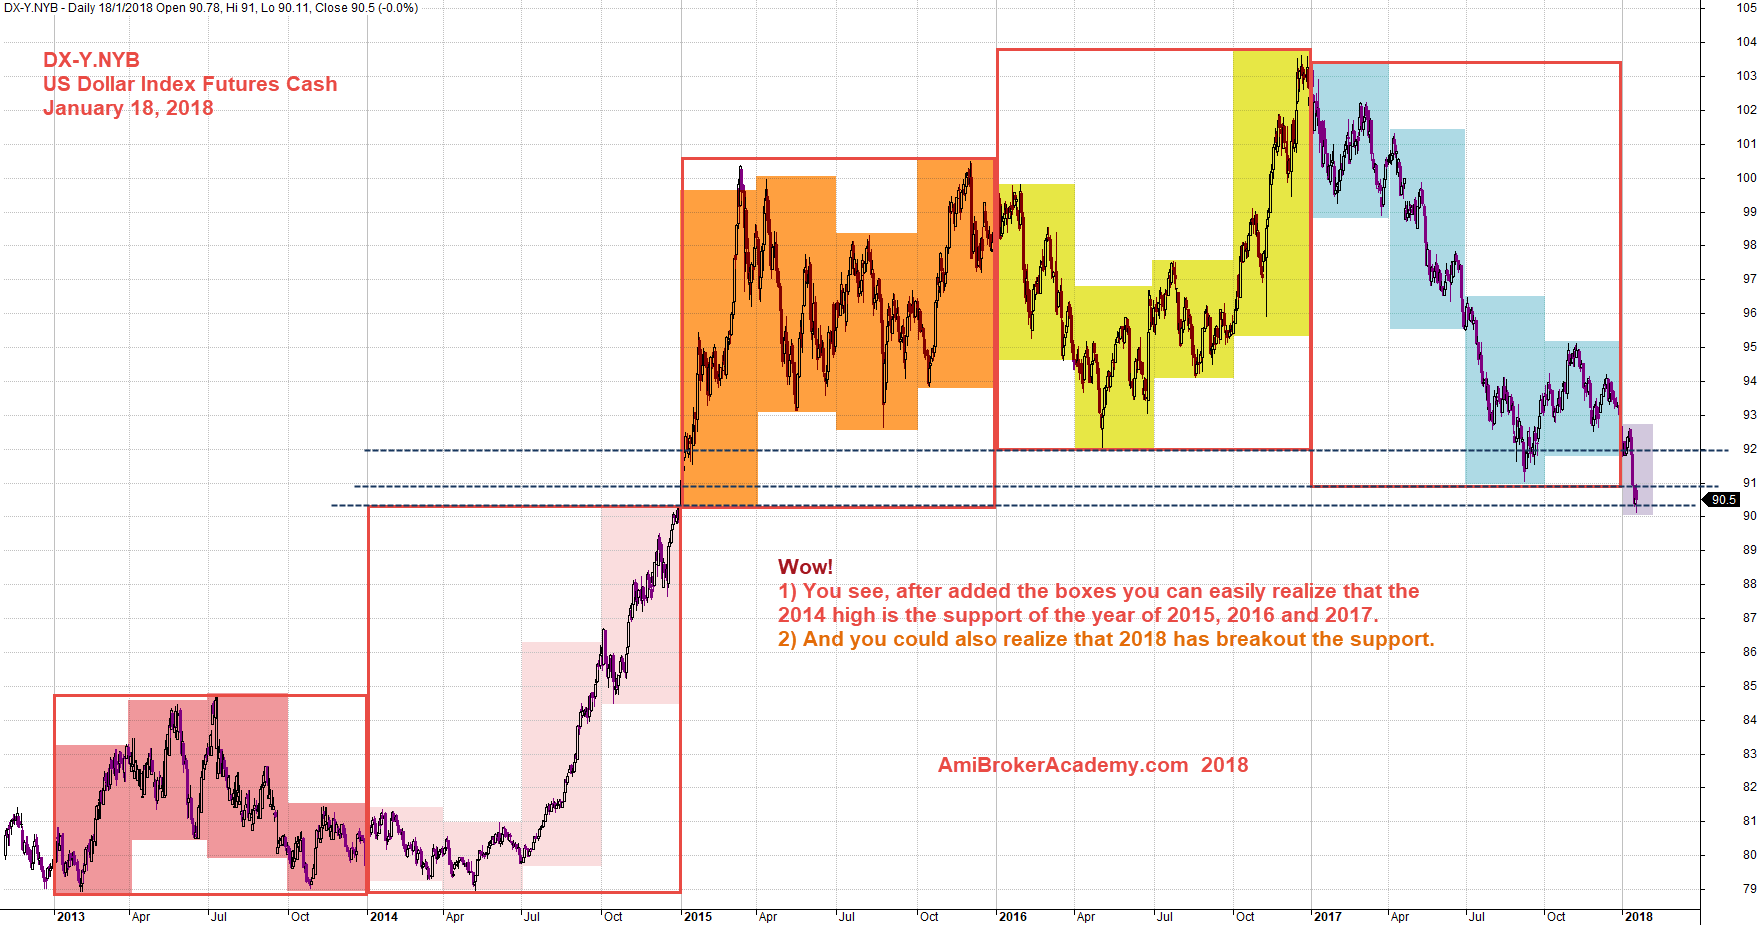
January 18, 2018 Dollar Index Quarter and Year High Low
Moses
AmiBrokerAcademy.com
Disclaimer
The above result is for illustration purpose. It is not meant to be used for buy or sell decision. We do not recommend any particular stocks. If particular stocks of such are mentioned, they are meant as demonstration of Amibroker as a powerful charting software and MACD. Amibroker can program to scan the stocks for buy and sell signals.
These are script generated signals. Not all scan results are shown here. The MACD signal should use with price action. Users must understand what MACD and price action are all about before using them. If necessary you should attend a course to learn more on Technical Analysis (TA) and Moving Average Convergence Divergence, MACD.
Once again, the website does not guarantee any results or investment return based on the information and instruction you have read here. It should be used as learning aids only and if you decide to trade real money, all trading decision should be your own.